
Graph with displaced point
Loading the math board and drawing, please wait…
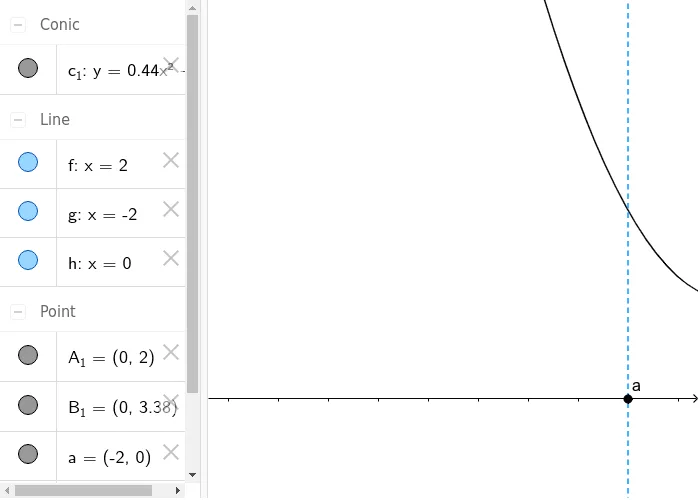
This example demonstrates a graph with a displaced point, allowing dynamic adjustments to observe geometric transformations and statistical distributions. Core concepts include continuity, orthocenter, Pythagorean theorem, variance, statistical characteristics, and centroid. Constructed using GeoGebra commands like Intersect, Point, and OrthogonalLine. Suitable for high school mathematics education.
GeoGebra Commands & Parameters
Intersect(c_1, yAxis, 1) → A_1Point(yAxis) → B_1Point(xAxis) → bPoint(xAxis) → aOrthogonalLine(b, xAxis) → fOrthogonalLine(a, xAxis) → gPoint(xAxis) → cOrthogonalLine(c, xAxis) → h