
Fractions, Decimals, Percents Template
Loading the math board and drawing, please wait…
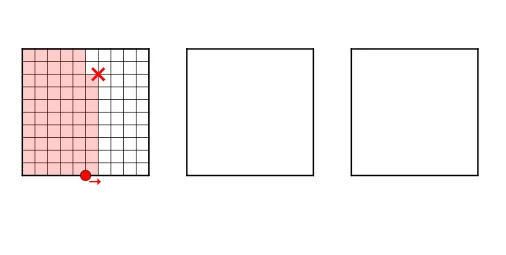
This example demonstrates the conversion and visualization of fractions, decimals, and percentages. It involves core math concepts like fractions, decimals, percentages, geometric constructions, conditional statements, and sequence generation. Key GeoGebra commands used include Corner, Point, Polygon, If, and Sequence, with objects such as A_1, A, B, poly3, i, j, k, l, poly4, m, n, p, q, integer, poly8, j_1, k_1, l_1, m_1, poly5, r, s, t, a_1, poly6, b_1, c_1, d_1, e_1, poly7, f_1, g_1, h_1, i_1, poly1, a, b, c, d, text1. It is suitable for middle school and above, helping students understand the connection between numbers and shapes, and enhancing mathematical application skills.
GeoGebra Commands & Parameters
Corner(5) → A_1Point(Sequence[(k, 0), k, 0, 3.6, 0.1]) → APoint(Sequence[(x(A) + 0.1, j), j, 0, 1, 0.1]) → BPolygon((1.3, 0), (2.3, 0), (2.3, 1), (1.3, 1)) → poly3, i, j, k, lPolygon((2.6, 0), (3.6, 0), (3.6, 1), (2.6, 1)) → poly4, m, n, p, qIf(x(A) ≥ 1 ∧ x(A) < x(Vertex[poly3, 1]) ∨ x(A) ≥ x(Vertex[poly3, 2]) ∧ x(A) < x(Vertex[poly4, 1]) ∨ x(A) ≟ x(Vertex[poly4, 2]), true, false) → integerPolygon(A, A + (0.1, 0), A + (0.1, If[integer, 0, y(B)]), A + (0, If[integer, 0, y(B)])) → poly8, j_1, k_1, l_1, m_1Polygon((0, 0), (Min[x(A), 1], 0), (Min[x(A), 1], 1), (0, 1)) → poly5, r, s, t, a_1Polygon((x(Vertex[poly3, 1]), 0), (Max[Min[x(A), x(Vertex[poly3, 1]) + 1], x(Vertex[poly3, 1])], 0), (Max[Min[x(A), x(Vertex[poly3, 1]) + 1], x(Vertex[poly3, 1])], 1), (x(Vertex[poly3, 1]), 1)) → poly6, b_1, c_1, d_1, e_1Polygon((x(Vertex[poly4, 1]), 0), (Max[Min[x(A), x(Vertex[poly4, 1]) + 1], x(Vertex[poly4, 1])], 0), (Max[Min[x(A), x(Vertex[poly4, 1]) + 1], x(Vertex[poly4, 1])], 1), (x(Vertex[poly4, 1]), 1)) → poly7, f_1, g_1, h_1, i_1Polygon((0.8187524918794742, 1.1041021645196354), (1.818752491879475, 1.1041021645196354), (1.818752491879475, 2.1041021645196336), (0.8187524918794742, 2.1041021645196336)) → poly1, a, b, c, dPolygon((0, 0), (1, 0), (1, 1), (0, 1)) → poly2, e, f, g, hSequence(Segment[(0, j), (1, j)], j, 0, 1, 0.1) → list4Sequence(Segment[(x(Vertex[poly3, 1]), j), (x(Vertex[poly3, 1]) + 1, j)], j, 0, 1, 0.1) → list5Sequence(Segment[(x(Vertex[poly4, 1]), j), (x(Vertex[poly4, 1]) + 1, j)], j, 0, 1, 0.1) → list6Sequence(Segment[(i, 0), (i, 1)], i, 0, 1, 0.1) → list1Sequence(Segment[(x(Vertex[poly3, 1]) + i, 0), (x(Vertex[poly3, 1]) + i, 1)], i, 0, 1, 0.1) → list2Sequence(Segment[(x(Vertex[poly4, 1]) + i, 0), (x(Vertex[poly4, 1]) + i, 1)], i, 0, 1, 0.1) → list3If(y(B) < 1, (100 * poly8), 0) → hundredthdigit
AI Drawing Prompt Reference
Create a geometric figure showing the conversion between fractions, decimals, and percentages. Start by drawing two rectangles to represent the fractional and decimal parts. Then, draw a series of vertical segments inside the rectangles to represent the decimal places. Next, dynamically generate segments inside the rectangles based on point A's position to represent the decimal part as a percentage. Finally, generate a rectangle based on point B's position to represent the percentage.
The prompt above was compiled from the original drawing commands and is for reference only.