
Adding and Subtracting to Solve Problems GeoGebra Example
Loading the math board and drawing, please wait…
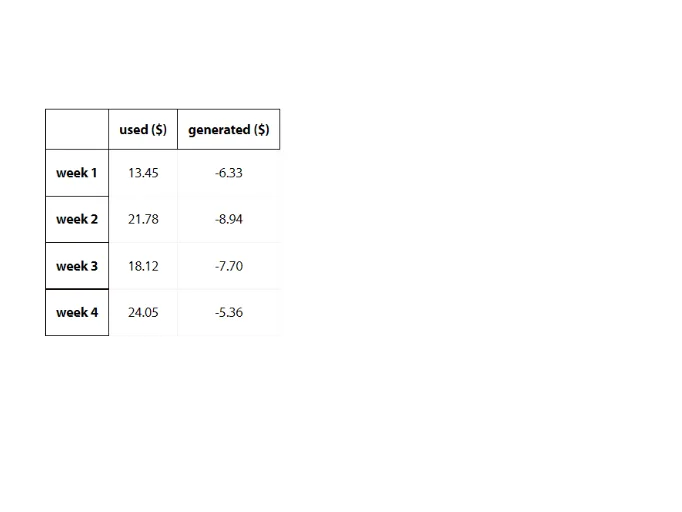
This example demonstrates the application of addition and subtraction in solving mathematical problems through dynamic GeoGebra visualization. It involves core concepts like coordinate geometry, statistical characteristics, circumcircle, Pythagorean Theorem, and expected value. The construction highlights the use of GeoGebra commands/objects such as pic1, focusing on geometric drawing and attribute calculations. Suitable for middle school mathematics education to help students understand how to apply addition and subtraction to solve real-world problems.
AI Drawing Prompt Reference
Draw a right triangle with a circle whose diameter is the hypotenuse of the triangle. Use coordinate geometry to mark the three vertices A, B, and C, with A and B on the x-axis and C on the y-axis. Use the Pythagorean theorem to calculate the hypotenuse length, then draw the circle. Randomly select a point D inside the triangle and calculate the distances from point D to each side of the triangle to understand the concept of expected value.
The prompt above was compiled from the original drawing commands and is for reference only.