
Graphical Solution of Systems of Linear Equations
Loading the math board and drawing, please wait…
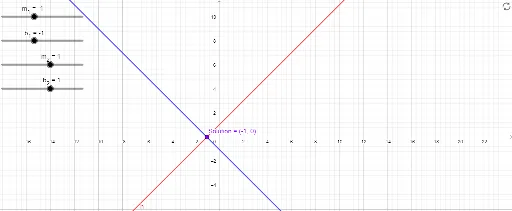
This GeoGebra example demonstrates the geometric interpretation of a system of two linear equations: the intersection point of two lines in the plane represents the solution. Core mathematical concepts include linear equations, slope and intercept, intersection of lines, and solution sets of systems. The construction uses the Intersect command on two lines f_1 (defined by slope m_1 and intercept b_1) and g (defined by slope m_2 and intercept b_2), producing the solution point h. Suitable for middle and high school students learning algebra and coordinate geometry, it helps visualize unique, no, or infinite solutions, and is ideal for classroom demonstrations or student exploration of how changing parameters affects the solution.
GeoGebra Commands & Parameters
Intersect(g, h) → Solution
AI Drawing Prompt Reference
Draw a Cartesian coordinate plane with two straight lines, each representing a linear equation. Each line is defined by its slope and intercept, adjustable via sliders. Mark the intersection point of the two lines clearly, as it represents the solution to the system. The graph should show the coordinates of the intersection and allow dynamic changes to parameters to visualize unique, no, or infinite solutions. Keep the layout clean for educational use.
The prompt above was compiled from the original drawing commands and is for reference only.