
Transformations of Absolute Values of Quadratic Functions
Loading the math board and drawing, please wait…
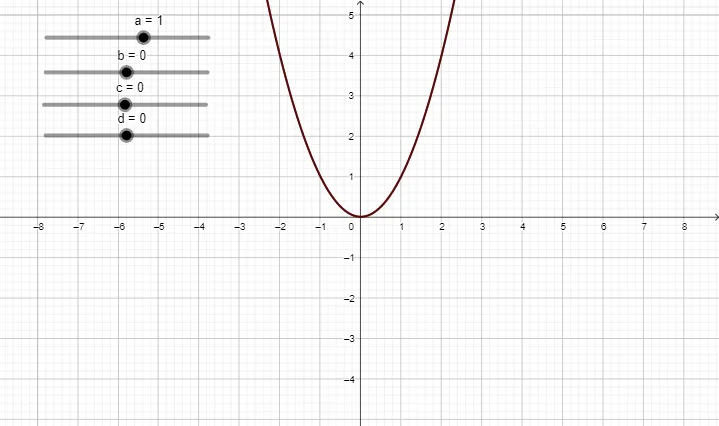
This example demonstrates the transformations of absolute values of quadratic functions in standard form. By adjusting parameters a, b, c, d, f, g using sliders, the changes in the shape and properties of the quadratic absolute value function's graph are visualized. Key math concepts include function transformations, absolute value function characteristics, and quadratic function graph features. GeoGebra sliders are used to dynamically manipulate parameters, providing an intuitive understanding of transformation effects. Suitable for high school mathematics education, focusing on function transformations and optimization problems.
GeoGebra Commands & Parameters
Numeric a(1)Numeric b(0)Numeric c(0)Numeric d(0)f(x) = abs(x^(2))g(x) = abs((a * x^(2)) + (b * x) + c) + d
AI Drawing Prompt Reference
Draw a graph of absolute value transformations of quadratic functions. The graph should include a parabolic curve and a vertically shifted version. The shape of the curve changes with parameter adjustments, such as the direction of the opening and width. Ensure the graph clearly shows the principles of function transformations while maintaining symmetry.
The prompt above was compiled from the original drawing commands and is for reference only.