
Graphical Solution of Quadratic Equations
Loading the math board and drawing, please wait…
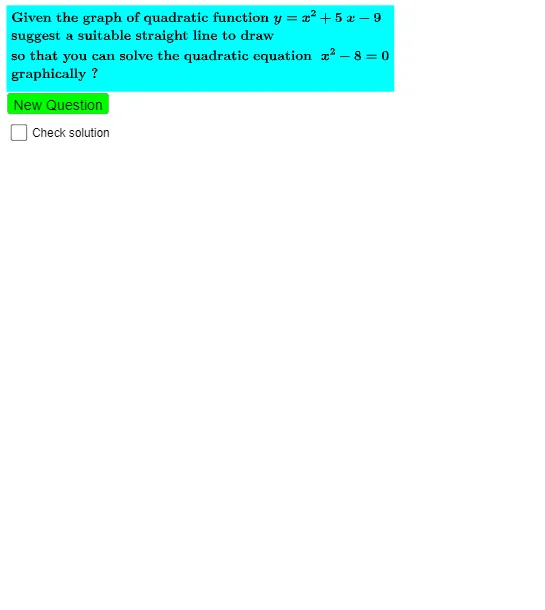
This example demonstrates how to solve quadratic equations graphically by adding a straight line to a quadratic function graph. Key math concepts include quadratic functions, linear equations, and intersection points of function graphs. GeoGebra commands and objects used in the construction are Random, RandomElement, Remove, If, Simplify, Intersect, Extremum, Expand, Factor, etc. Suitable for high school mathematics teaching, helping students understand and review the graphical method for solving quadratic equations.
GeoGebra Commands & Parameters
Random(-8, 9) → B1, 5Random(-4, 5) → D1, 5RandomElement({1, 1, 2, 1}) → A1, 1Random(-13, 15) → C1, -9Remove({emin, emin + 1, emin + 2, emin + 3, emin + 4, emin + 5}, {0}) → listE1aIf(emin > Element[listE1, 1], RandomElement[listE1a], RandomElement[listE1]) → k1Simplify((D1 * x) + E1) → G1Simplify((A1 * x^(2)) + (B1 * x) + C1) → F1Simplify(F1(x) - G1(x)) → H1Random(-8, 9) → B2, 7Random(-13, 15) → C2, 12RandomElement({1, 1, 2, 1}) → A2, 1Random(-4, 5) → D2, 4Simplify((D2 * x) + E2) → G2Simplify((A2 * x^(2)) + (B2 * x) + C2) → F2Simplify(F2(x) - G2(x)) → H2Intersect(G1, F1) → A, BExtremum(F1) → CExpand(H1(x) + G1(x)) → J1Factor(Simplify[H1(x) + G1(x)]) → I1If(TextToUnicode[Text[J1]] ≟ TextToUnicode[Text[I1]], true, false) → K1
AI Drawing Prompt Reference
Draw a quadratic function curve and a straight line on the same coordinate plane. The curve opens upward with its vertex determined by random parameters, while the line has random slope and intercept. Mark the two intersection points of the curve and line. Also display the new quadratic function obtained by subtracting the line from the curve, and show its factored form to reveal the roots corresponding to the intersections. Indicate the extremum point of the original curve. Use a check to confirm whether the expanded and factored forms of the new function are equivalent. This visual helps solve quadratic equations graphically.
The prompt above was compiled from the original drawing commands and is for reference only.