
Graphical Solution of Non-Linear Simultaneous Equations by Selina Chan
Loading the math board and drawing, please wait…
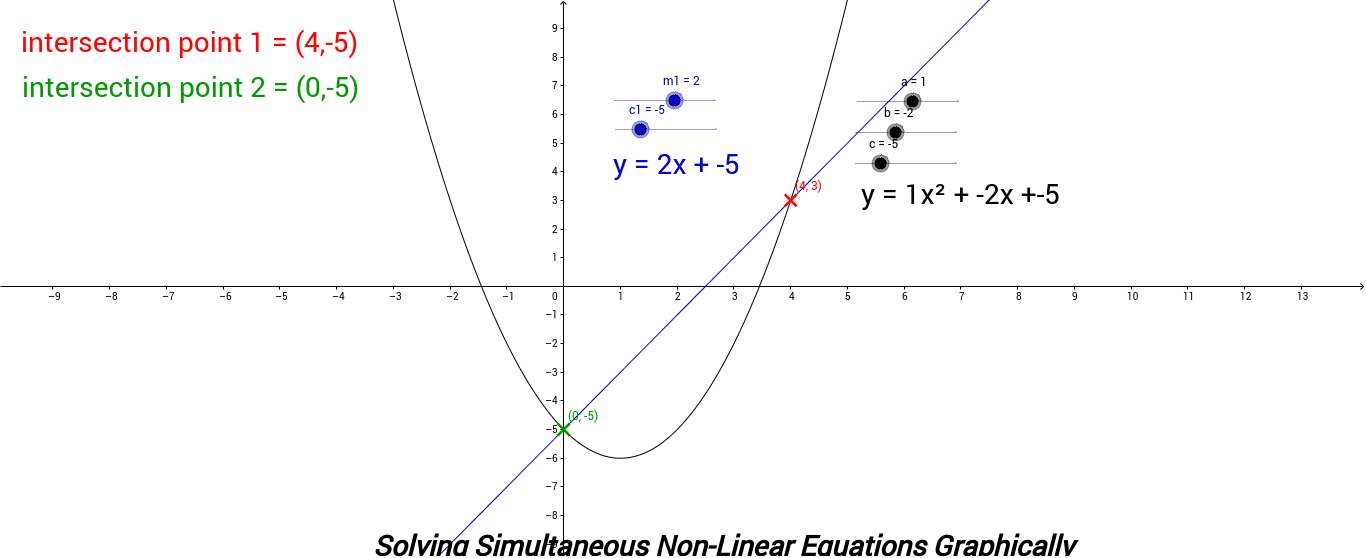
This example demonstrates how to solve non-linear simultaneous equations graphically by plotting multiple functions and finding their intersections. Key math concepts include non-linear equations, function graphs, and intersection points. GeoGebra's Intersect command is used to determine the intersection points of various functions (e.g., m1, c1, a, b, a_1). Suitable for high school and above, helping learners understand geometric solutions and dynamic changes in non-linear systems.
GeoGebra Commands & Parameters
Intersect(d, a_1) → A, B
AI Drawing Prompt Reference
Draw two non-linear curves m1 and a1, and two lines c1 and a, and find their intersection points. First, draw the curves m1 and a1, then draw the lines c1 and a, and finally use the intersect command to find the intersection points of these curves and lines.
The prompt above was compiled from the original drawing commands and is for reference only.