
Graphical Solution of Simultaneous Non-Linear Equations
Loading the math board and drawing, please wait…
In collections
Quadratic functions
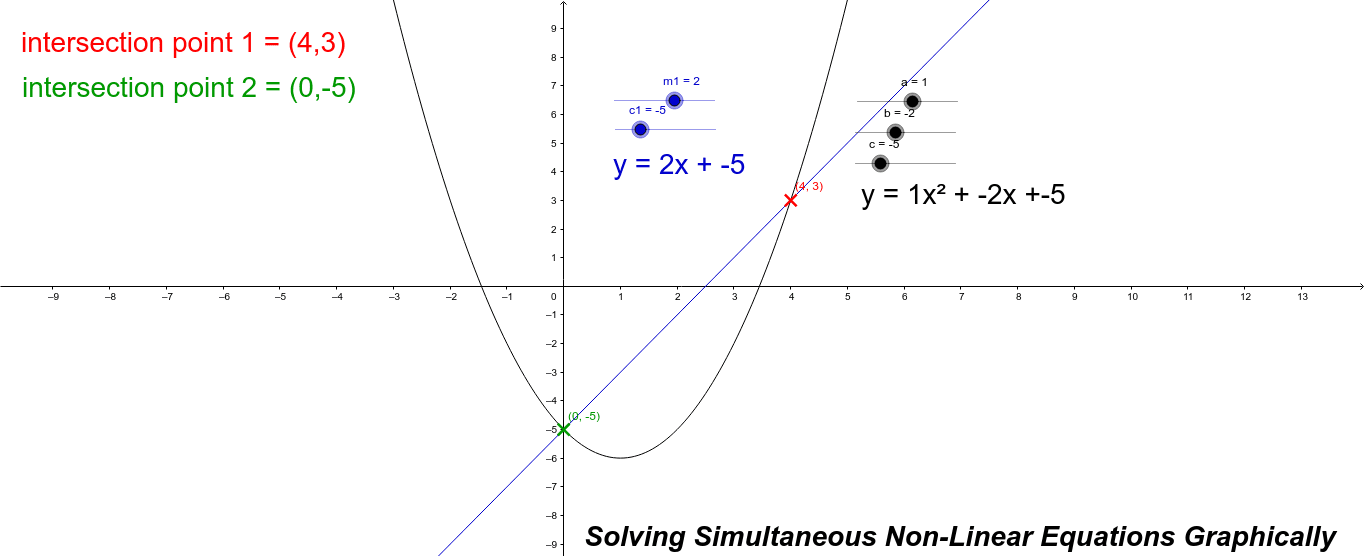
This example demonstrates how to solve simultaneous non-linear equations graphically, visually showing the solution set of the equation system. Core math concepts include non-linear equations, function graphs, intersection points, and analytical geometry. Key GeoGebra commands used are Intersect to find intersections among objects like m1, c1, a, b, a_1, and text objects for labeling. Suitable for high school and above learners to understand the geometric meaning and methods of solving non-linear equation systems.
GeoGebra Commands & Parameters
Intersect(d, a_1) → A, B