
Explore how a, b, c affect quadratic graph
Loading the math board and drawing, please wait…
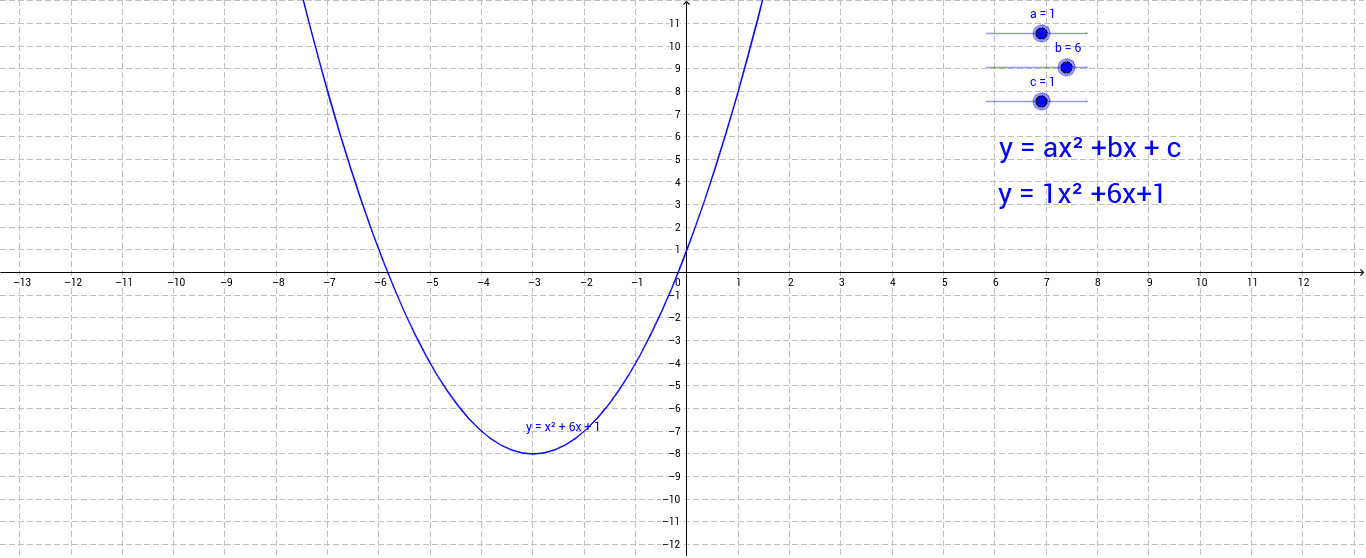
This example demonstrates how adjusting the parameters a, b, and c influences the graph of a quadratic function y=ax²+bx+c. It covers core math concepts like quadratic functions, function graphs, and parameter effects. Constructed using GeoGebra objects: a, b, c, d, text1, text2. Suitable for high school students to learn quadratic function properties and function graphing.
GeoGebra Commands & Parameters
Numeric a(1.0)Numeric b(6.0)Numeric c(1.0)y = a * x^(2) + b * x + c