
Graphical Method for Solving Quadratic Equations (III)
Loading the math board and drawing, please wait…
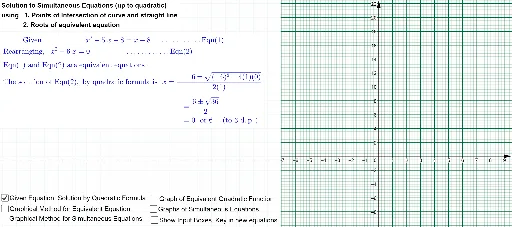
This example demonstrates solving quadratic equations graphically. Key math concepts include roots, coefficients, and the quadratic formula. Commands used include Simplify, Intersect, Polygon, etc. Suitable for high school math education and learning.
GeoGebra Commands & Parameters
Simplify(f(x) - g(x)) → hTextfield(txtf) → inpfTextfield(txtg) → inpgTextfield(txth) → inphIntersect(h, xAxis) → G, HPolygon(Corner[1], (((x(Corner[1]) + x(Corner[2])) * 1 / 2.5), y(Corner[1])), (((x(Corner[3]) + x(Corner[4])) * 1 / 2.5), y(Corner[4])), Corner[4]) → q1, k, l, m, nRoot(h) → I, JCoefficients(h) → hcoeffElement(hcoeff, 1) → a_hElement(hcoeff, 2) → b_hElement(hcoeff, 3) → c_hIntersect(g, f) → E, F
AI Drawing Prompt Reference
Create a visual representation for solving quadratic equations graphically. Plot two functions and identify their intersections with each other and the x-axis. Construct a polygon based on these points, and display the roots and coefficients of the equation. Finally, show the intersection points of the two functions to highlight the geometric meaning of the solution.
The prompt above was compiled from the original drawing commands and is for reference only.