
Graphical Demonstration of the Derivative of Sine x
Loading the math board and drawing, please wait…
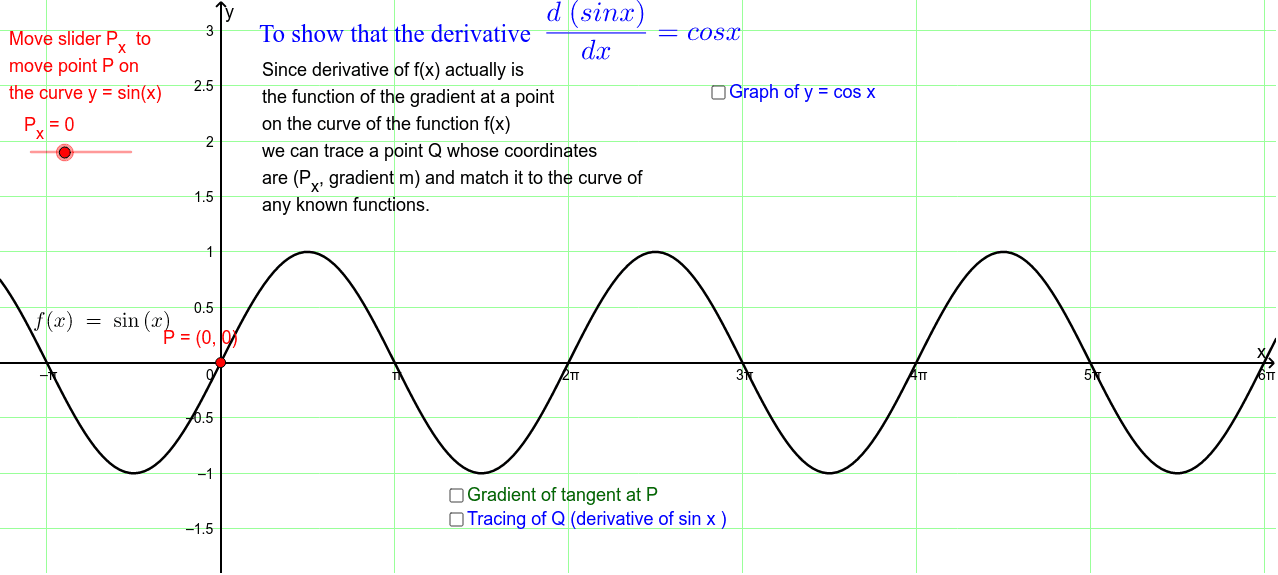
This example graphically demonstrates the derivative of the sine function, involving core math concepts like derivatives, sine function, slope, and vectors. It utilizes GeoGebra commands such as Tangent, Slope, Vector, and Midpoint for construction, making it suitable for high school and above students studying calculus.
GeoGebra Commands & Parameters
Tangent(P, f) → bSlope(b) → mVector(Q, Q_y) → uMidpoint(Q_y, Q) → AVector(P, P_{xaxis}) → vVector(Q, P_{xaxis}) → w
AI Drawing Prompt Reference
Draw the graph of the sine function and at a point on the curve, plot the tangent line, label its slope, then draw a vector from the point of tangency to the derivative (cosine function) of the sine curve, also label the vector from the point of tangency to the slope of the tangent line, and finally draw vectors from the point of tangency to the x-axis and from the point of tangency to the projection of the point on the x-axis, demonstrating the geometric meaning of the derivative of the sine function.
The prompt above was compiled from the original drawing commands and is for reference only.