
Graphical Animation of Average Value by Jason Slowbe
Loading the math board and drawing, please wait…
In collections
Average Value
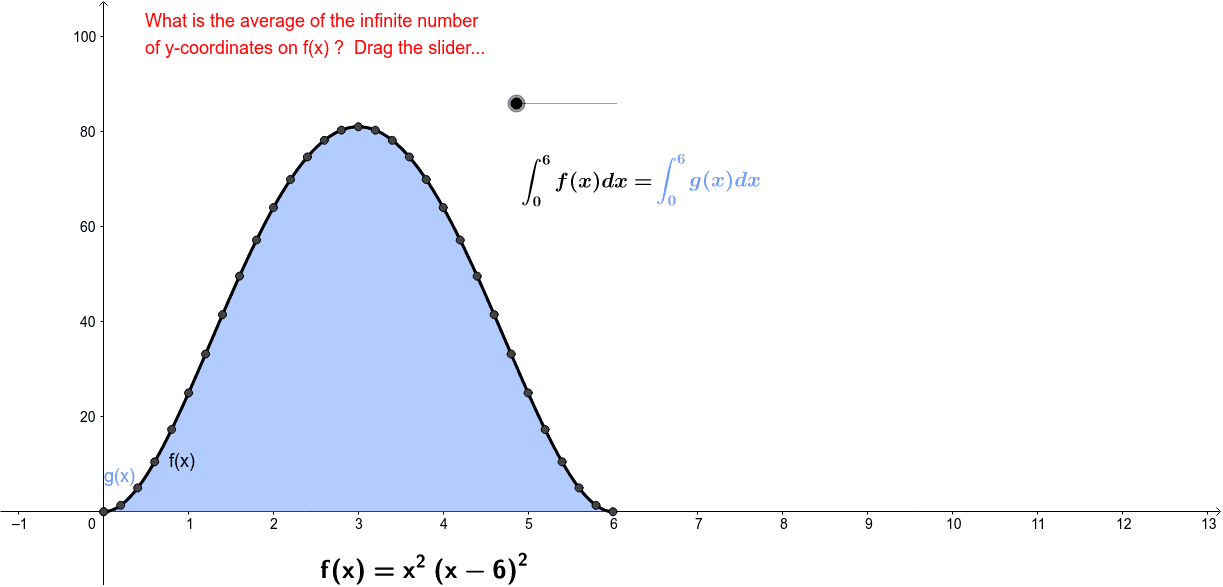
This example demonstrates the graphical animation of the average y-value of a function over an interval. It involves core calculus concepts like integration, function graphs, and average value calculation. Constructed using GeoGebra commands such as Function, Integral, and Segment, along with objects like segments and text. Ideal for high school and above students studying calculus, function properties, and expected values in probability statistics.
GeoGebra Commands & Parameters
Function(43.2, 0, 6) → hFunction((x^(2) * (x - 6)^(2)), 0, 6) → fFunction(((1 - a) * f(x)) + (a * h(x)), 0, 6) → gIntegral(g, 0, 6) → kSegment(Q_2, J_1) → bSegment(P_2, I_1) → cSegment(O_2, H_1) → dSegment(N_2, G_1) → eSegment(M_2, F_1) → iSegment(K_2, D_1) → jSegment(J_2, C_1) → lSegment(I_2, B_1) → mSegment(H_2, A_1) → nSegment(L_2, E_1) → pSegment(G_2, Z) → qSegment(F_2, W) → rSegment(V_1, O) → sSegment(U_1, N) → tSegment(T_1, M) → a_1Segment(S_1, L) → b_1Segment(R_1, K) → c_1Segment(Q_1, J) → d_1Segment(P_1, I) → e_1Segment(O_1, H) → f_1Segment(V, E_2) → g_1Segment(D_2, U) → h_1Segment(T, C_2) → i_1Segment(B_2, S) → j_1Segment(R, A_2) → k_1Segment(Z_1, Q) → l_1Segment(P, W_1) → m_1Segment(N_1, G) → n_1Segment(F, M_1) → p_1Segment(L_1, E) → q_1Segment(A, K_1) → r_1
AI Drawing Prompt Reference
Draw a function graph showing the dynamic process of the average value over the interval [0, 6]. Start by plotting two base functions: one constant and one quadratic. Then, create a new function that is a weighted average of the base functions by adjusting a parameter dynamically. Next, compute the definite integral of the new function over [0, 6] to find the average value. Finally, use multiple line segments to connect key points on the function graph to the average value line, demonstrating the dynamic effect.
The prompt above was compiled from the original drawing commands and is for reference only.