
Cherry Blossoms - Logarithmic Regression
Loading the math board and drawing, please wait…
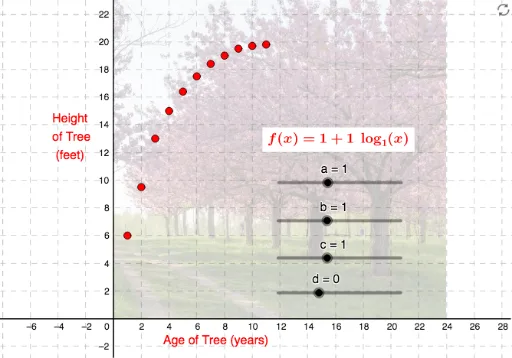
This example simulates the logarithmic regression curve of cherry blossoms, demonstrating the properties of logarithmic functions. It involves core concepts of logarithmic functions, and through the construction of objects and commands such as A1, B1, A, B, etc., it provides a clear understanding of the graph and properties of logarithmic functions. Suitable for high school mathematics education, particularly in the teaching of functions and statistics.
GeoGebra Commands & Parameters
123456789101169.5131516.417.518.41919.519.719.8(A2, B2)(A3, B3)(A4, B4)(A5, B5)(A6, B6)(A7, B7)(A8, B8)(A9, B9)(A10, B10)(A11, B11)(A12, B12){A, B, C, D, E, F, G, H, I, J, K}Numeric a(1)Numeric b(1)Numeric c(1)Numeric d(0)f(x) = a + (b * log(c, x + d))Point L(3.641069835629221, 0.9185104384734739)Point M(10.138926912177313, 0.9185104384734739)Point N(3.641069835629221, 0.9185104384734739)Point O(10.138926912177313, 0.9185104384734739)Point P(1.6120397844139882, 3.6868907379850544)Point Q(29.32865178477539, 3.6868907379850544)g(x) = 0
AI Drawing Prompt Reference
Draw a logarithmic regression curve graph to show the fitting of cherry blossom growth data with a logarithmic function, including two points as the data base, calculate to get the regression curve, and label key data points and the curve to reflect the properties of logarithmic functions, suitable for high school mathematics education.
The prompt above was compiled from the original drawing commands and is for reference only.