
Cars race - linear system
Loading the math board and drawing, please wait…
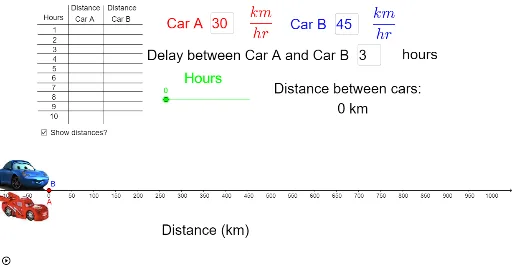
This example demonstrates the relationship between speed and time in a car race using linear equations and geometric constructions. Key mathematical concepts include linear functions, slope, coordinate geometry, and geometric construction. The construction involves using GeoGebra commands like Textfield, Segment, and Max to create the race track, along with input boxes and text fields for parameters. Suitable for middle school or high school students learning linear equations and geometric applications.
GeoGebra Commands & Parameters
Textfield(a) → inputBox1Textfield(b) → inputBox2Segment(C, D) → dSegment(E, F) → eSegment(G, H) → fSegment(I, J) → gSegment(K, L) → hSegment(M, N) → iSegment(O, P) → jSegment(Q, R) → kSegment(S, T) → lSegment(U, V) → mSegment(W, Z) → nSegment(A_1, B_1) → a_1Textfield(k_1) → inputBox3Max(hours - k_1, 0) → l_1Max(m_1, 0) → n_1Max(z, 0) → o_1Max(b_1, 0) → p_1Max(c_1, 0) → q_1Max(d_1, 0) → r_1Max(e_1, 0) → s_1Max(f_1, 0) → t_1Max(g_1, 0) → u_1Max(h_1, 0) → v_1Max(i_1, 0) → w_1
AI Drawing Prompt Reference
Draw a car race track diagram with a straight track and multiple track segments. Arrows indicate direction between segments, and markers show start and end points. The relationship between track length and time is represented by linear equations, with points on the track representing vehicles at different speeds. The construction order is to draw the track first, then add track segments, and finally add the speed and time relationship lines.
The prompt above was compiled from the original drawing commands and is for reference only.