
Graph with Mapping Diagram: Estimating The Derivative
Loading the math board and drawing, please wait…
In collections
Graphs and Mapping Diagrams
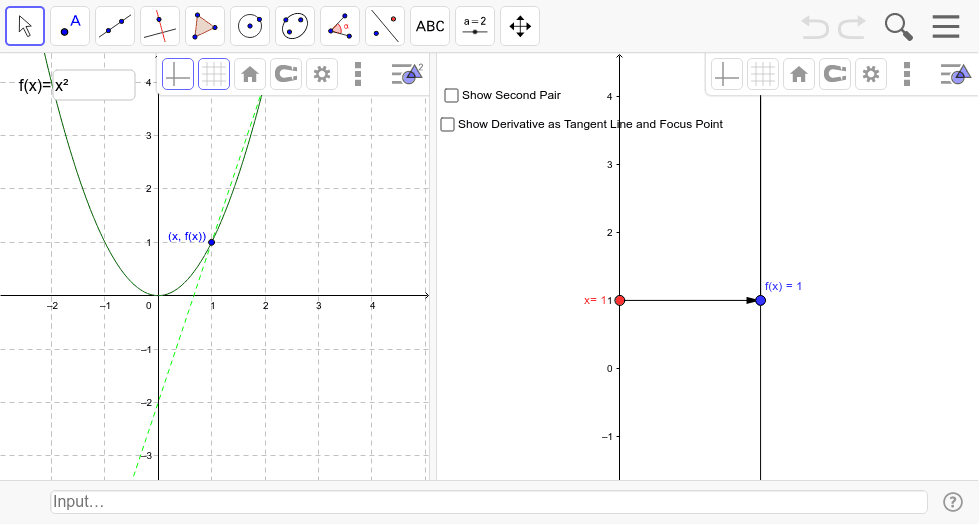
This example demonstrates the features of function-based first and second derivatives on graphs and mapping diagrams. It involves the concept of derivatives, dynamically showing the estimation process through adjusting function parameters with sliders. Commands used include Point, Vector, Textfield, Segment, Line, Derivative, Intersect, among others. Suitable for high school mathematics education and learning derivative concepts.
GeoGebra Commands & Parameters
Point(yAxis) → AVector(A, B) → f_vTextfield(f) → inputBox1Vector(x_1, y_1) → vSegment(f_x, F) → cSegment(E, F) → dSegment(A, x_1) → eSegment(B, y_1) → gSegment(B, y_1) → h_1Line(x_1, y_1) → iLine(A, B) → kTextfield(f) → inputBox2Derivative(f) → f'Vector(B, C) → uLine(C, D) → bIntersect(b, k) → FocusLine(E, f_x) → mLine(x_1, y_1) → nLine(A, B) → pIntersect(n, p) → G
AI Drawing Prompt Reference
Draw a function graph and its corresponding mapping diagram to illustrate the concepts of first and second derivatives. Start by drawing point A on the y-axis and vector f_v from A to B. Input function f, then draw vector v and point (x_1, y_1). Draw segment c from f_x to F, segment d from E to F, segment e from A to x_1, segment g from B to y_1, and segment h_1 from B to y_1. Draw line i through (x_1, y_1), line k through A and B, input function f, draw its first derivative f', draw vector u from B to C, line b through C and D, find the intersection of b and k as Focus, draw line m from E to f_x, line n through (x_1, y_1), line p through A and B, and find the intersection of n and p as G.
The prompt above was compiled from the original drawing commands and is for reference only.