
Graph Transformations by Gareth Daniels
Loading the math board and drawing, please wait…
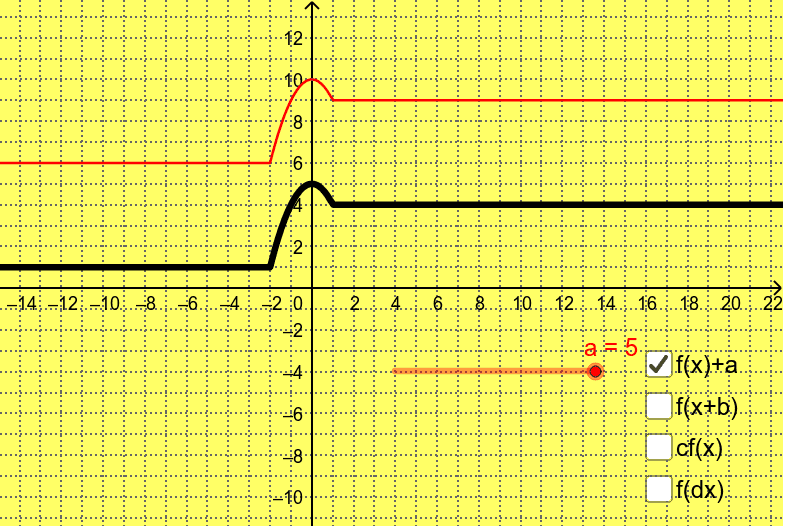
This example demonstrates transformations of function graphs, including reflection and translation. Using input boxes and buttons, the process of transforming function f to g can be dynamically shown. Mainly using If statements, text fields, and function objects in GeoGebra.
GeoGebra Commands & Parameters
If(x < -2, 1, If[-2 ≤ x ≤ 1, 5 - x^(2), 4]) → fTextfield(r) → inputBox1
AI Drawing Prompt Reference
Draw a function graph to demonstrate transformations including reflection and translation. Use an input box to enter parameters and dynamically show the transformation of function f to g using buttons. The main function is a piecewise function defined as: value is 1 when x < -2, 5 - x^2 when -2 ≤ x ≤ 1, and 4 when x > 1. Also include a text input box for parameter input.
The prompt above was compiled from the original drawing commands and is for reference only.