
Graph the Line by Steve Phelps
Loading the math board and drawing, please wait…
In collections
Linear equations
Chapter 3__Graphing Linear Functions
Slope
Vectors and scalars
Test 3 Review Activities
Cool Things from Geogebra
Algebra I graphing linear equations
Lines and Linear Equations
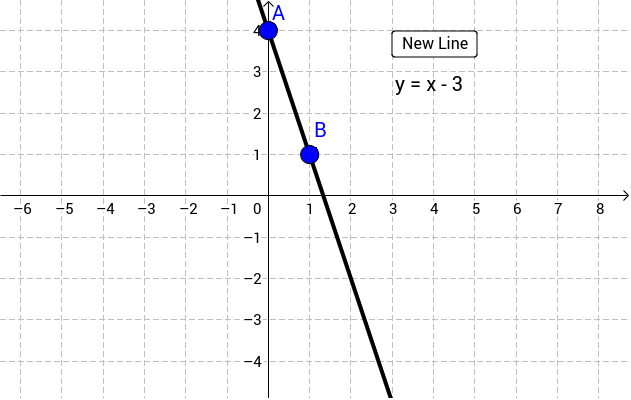
This example demonstrates how to graph a line by dragging points A and B. It involves core math concepts like function graphs, linear equations, and linear functions. Constructed using GeoGebra commands such as Line, and objects like button1, text1, A, B, b, text2 for interaction and labeling. Suitable for middle school and above students learning function graphing and linear equations, or for classroom demonstrations.
GeoGebra Commands & Parameters
Line(A, B) → b
AI Drawing Prompt Reference
Draw a line defined by two draggable points, showing its equation. The line updates dynamically as the points are moved, and its equation is displayed. Suitable for demonstrating basic concepts of linear functions and equations.
The prompt above was compiled from the original drawing commands and is for reference only.