
Graph of a Function Defined by a Definite Integral
Loading the math board and drawing, please wait…
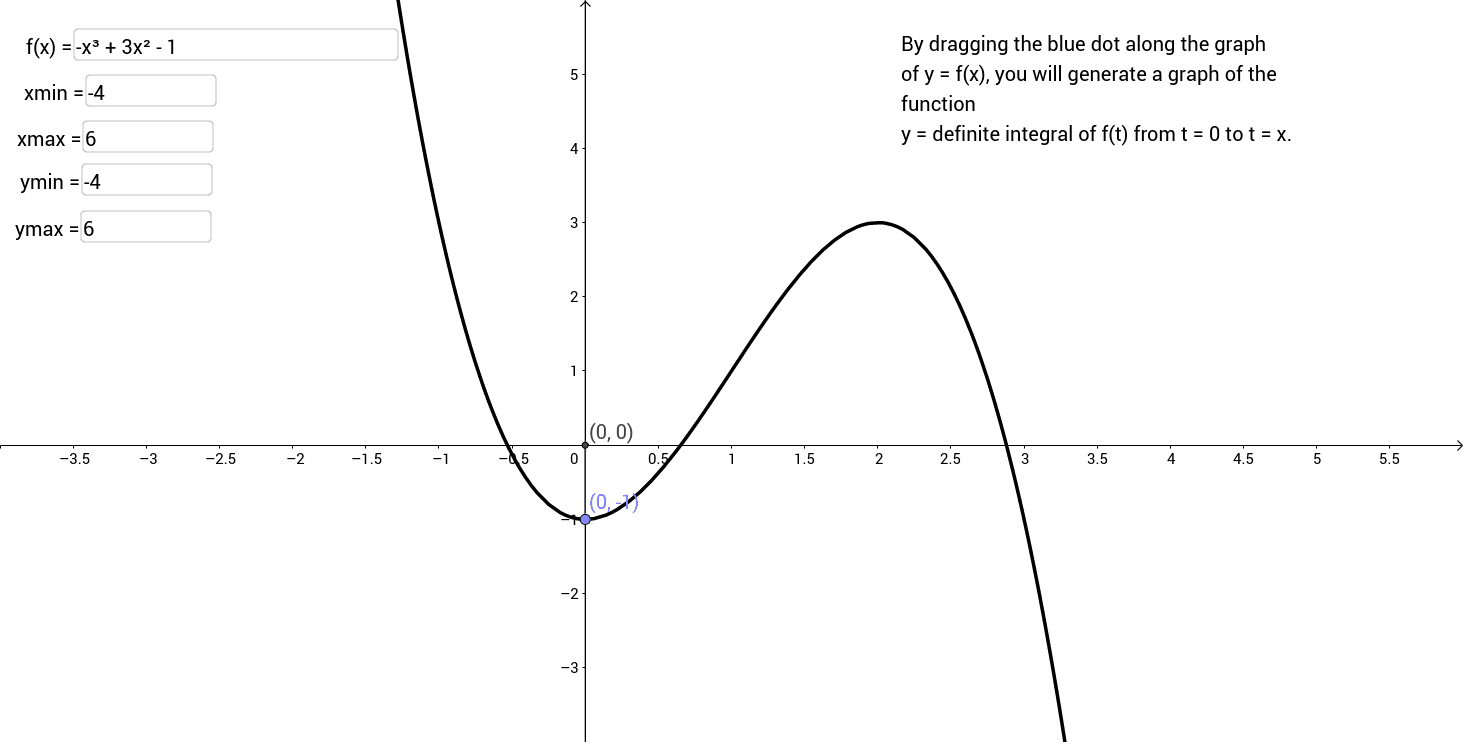
This example demonstrates how to draw the graph of a function defined by a definite integral. Key math concepts include definite integral, function graph, and integration over the interval [a,b]. Construction highlights involve using GeoGebra commands/objects like Point, OrthogonalLine, Integral, and Textfield. Suitable for high school and above students to learn about the application of definite integrals and function graphing.
GeoGebra Commands & Parameters
Point(f) → AOrthogonalLine(A, xAxis) → aIntegral(f, 0, x(A)) → bTextfield(f) → inputBox1Textfield(xmin) → inputBox2Textfield(xmax) → inputBox3Textfield(ymin) → inputBox4Textfield(ymax) → inputBox5
AI Drawing Prompt Reference
Draw the graph of a function defined by a definite integral. Start by taking a point A on the x-axis, then draw a perpendicular line a through A. Calculate the definite integral b from 0 to the x-coordinate of A. Input the function expression through inputBox1 and set the x-axis and y-axis range via inputBox2 to inputBox5.
The prompt above was compiled from the original drawing commands and is for reference only.