
Symmetry of the Sinusoidal Graph
Loading the math board and drawing, please wait…
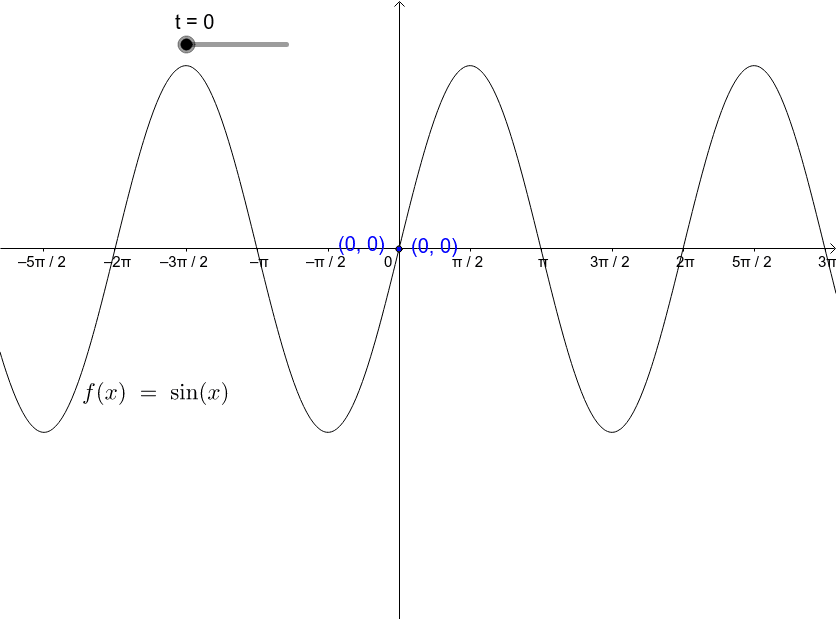
This example demonstrates the symmetry of the graph of the sine function y=sin(x), specifically its origin-based central symmetry. Key math concepts include function graphs, symmetry, and properties of trigonometric functions. The construction uses GeoGebra commands Segment and objects like f (function), t (parameter), A,B (points), and a (value). Suitable for high school mathematics education to visually illustrate and understand the symmetry characteristics of the sine function.
GeoGebra Commands & Parameters
Segment(B, A) → a
AI Drawing Prompt Reference
Draw the graph of the sine function y=sin(x) and illustrate its origin-based central symmetry. First, plot the sine function curve, then mark the origin. Next, select two symmetric points on the curve relative to the origin and connect them with a line segment that passes through the origin to visually demonstrate the central symmetry of the sine function graph.
The prompt above was compiled from the original drawing commands and is for reference only.