
Gradient of y=x^3: Tangent Slope Visualization
Loading the math board and drawing, please wait…
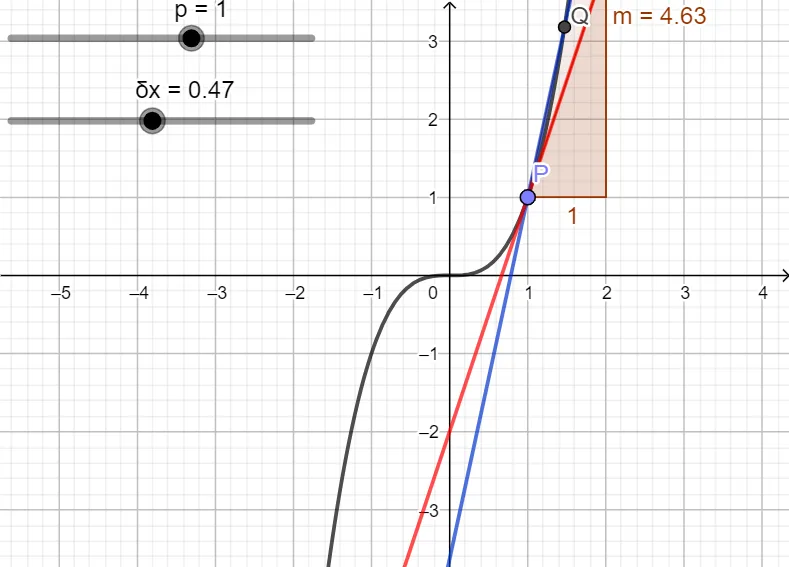
This GeoGebra example visualizes the gradient (slope) of the tangent line to the cubic function y=x³ at any point, demonstrating the geometric interpretation of the derivative. It highlights core calculus concepts: derivative, tangent line, slope, and the limit process. Users can drag point P to see the secant line (g) approach the tangent line (h), with slope values m and m_1 updating dynamically. The construction uses commands Line, Tangent, and Slope, along with objects f, p, P, δx, Q, g, h, m, m_1, and auxiliary rectangles and special points. Ideal for high school or early college students learning differential calculus, and for teachers to illustrate how the derivative of x³ equals 3x². The interactive nature helps grasp the transition from secant to tangent and the concept of instantaneous rate of change.
GeoGebra Commands & Parameters
Line(P, Q) → gTangent(P, f) → hSlope(g) → mSlope(h) → m_1
AI Drawing Prompt Reference
Draw a coordinate plane with a smooth cubic curve passing through the origin. Place a draggable point on the curve, and draw a tangent line at that point. Also, take another point very close to it on the curve, and connect these two points to form a secant line. Display the slope values of both lines, and as the point is dragged, the secant line should approach the tangent line, showing how the slope changes. Use distinct colors for the curve, tangent, and secant, and label the key points.
The prompt above was compiled from the original drawing commands and is for reference only.