
Probabilities for Normal Distribution (Gauss Curve)
Loading the math board and drawing, please wait…
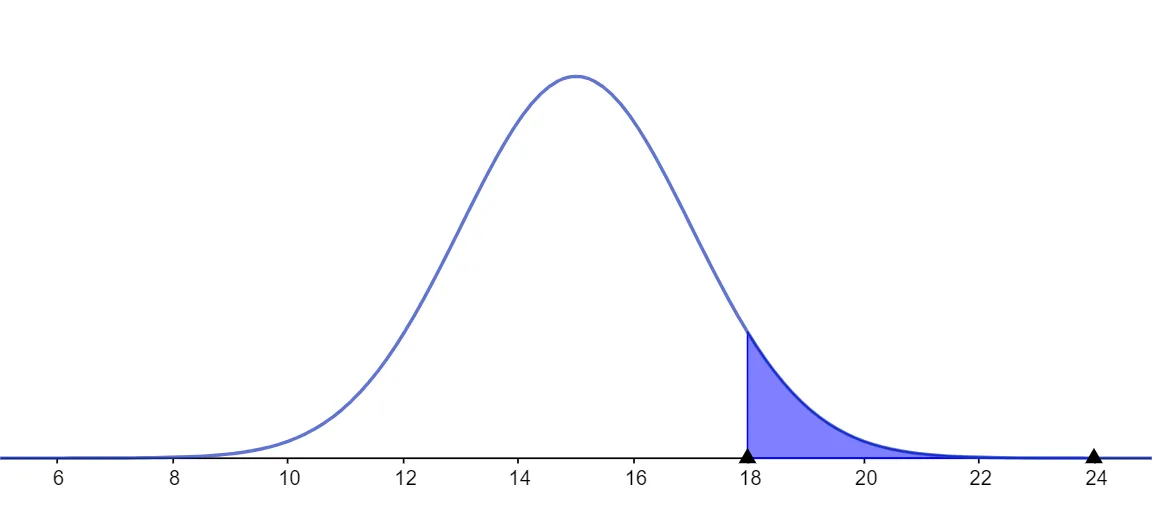
This example demonstrates the normal distribution (Gauss curve) probability density function and visually presents the area under the curve as probability. Core mathematical concepts include the normal distribution, probability density function, expectation and standard deviation, integral area under the curve, and foundations of statistical inference. Regarding construction, the original construction summary is empty and no specific GeoGebra commands are recorded; typically one can use objects such as NormalDistribution, Function, and Probability together with sliders to dynamically adjust the mean and variance, draw the Gaussian curve, and shade interval probability regions. This example is suitable for high school elective courses or university probability and statistics classrooms, helping learners intuitively understand how parameter changes affect curve shape and compute probability values for given intervals.
AI Drawing Prompt Reference
Draw a normal distribution curve and use sliders to adjust the mean and standard deviation. First create a normal distribution object, then plot its probability density function. Use the sliders to dynamically change the mean and standard deviation, and finally fill the selected interval with color to represent the probability of that interval.
The prompt above was compiled from the original drawing commands and is for reference only.