
Gradient of y=x²: Tangent Slope and Derivative Visualization
Loading the math board and drawing, please wait…
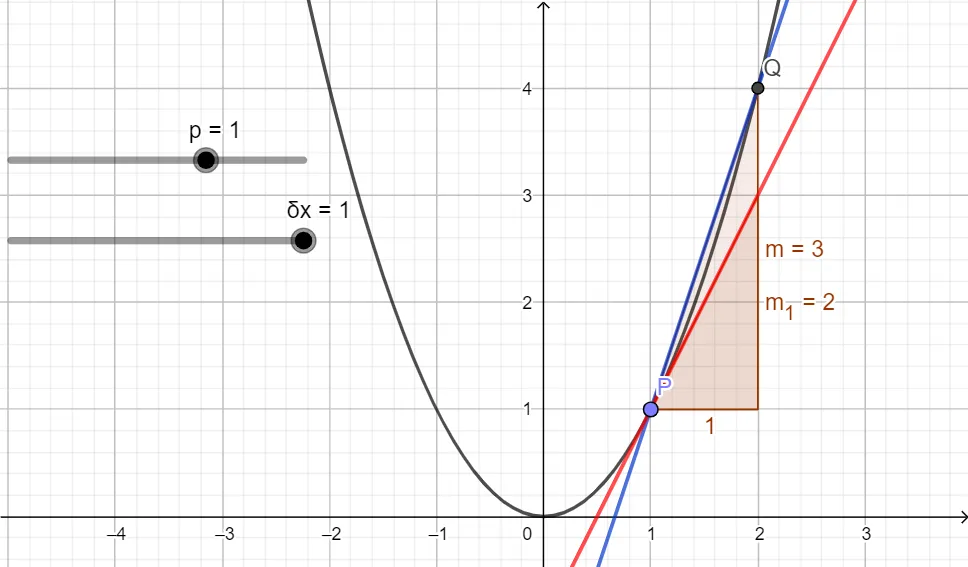
① This interactive GeoGebra example dynamically illustrates how the slope of the tangent line to the parabola y=x² changes as a point moves along the curve, while also showing the secant slope approaching the tangent slope. ② The core mathematical concept is the geometric meaning of the derivative: the derivative at a point equals the slope of the tangent line, involving limits, difference quotients (average rate of change), and tangent line equations. ③ Construction details: using GeoGebra commands Line, Tangent, and Slope, the applet builds the function f, a movable point P, a small increment δx, an auxiliary point Q, a secant line g, a tangent line h, and slope values m and m_1, allowing users to drag P or adjust δx to observe slope behavior. ④ Suitable for high school or introductory college calculus students to grasp the definition of the derivative, tangent slope, and instantaneous rate of change, and also useful for teachers as a classroom demonstration tool.
GeoGebra Commands & Parameters
Line(P, Q) → gTangent(P, f) → h,Slope(g) → mSlope(h) → m_1
AI Drawing Prompt Reference
Draw an upward-opening parabola with a movable point on it. At this point, construct a tangent line to the curve)Skip, and also place a nearby second point on the parabola, connecting the two points with a secant line. Display the numerical slopes of both the tangent and the secant, and show that as the second point approaches the first, the secant slope approaches the tangent slope. Clearly label the parabola, the tangent point, the secant, the tangent, and their slope values, to illustrate the geometric meaning of the derivative as the slope of the tangent.
The prompt above was compiled from the original drawing commands and is for reference only.