
Tangent Line and Slope Change: Limits to Derivatives
Loading the math board and drawing, please wait…
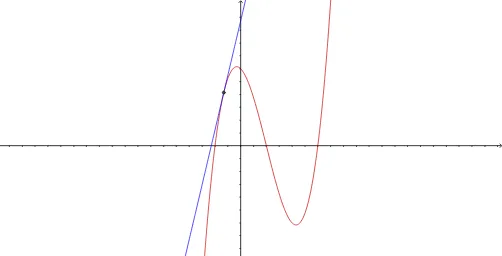
This GeoGebra example lets you drag a point along a given curve and observe how the tangent line’s steepness (slope) changes at different locations. The activity is designed to build intuition for the idea that the slope of a tangent line corresponds to a rate of change captured in the limit process. The main math concepts are function graphs, tangent lines, local linear approximation, and the relationship between limits and derivatives. Construction-wise, the setup uses the function object f to represent the original curve, a as the moving point (or chosen tangency point), A as a key auxiliary object tied to the construction, and g as the tangent line (its equation or geometric representation). As a is dragged, g updates accordingly, making the connection between limit-based slope and derivative visually immediate. Suitable for high-school advanced learners and introductory calculus students, especially for teaching and learning limits leading to derivatives via graphing and interactive geometry.
GeoGebra Commands & Parameters
f(x) = (((x - 1) * (x + 1)) * (x - 3))Numeric a(-0.6585365853658537)(a, f(a))g(x) = (f'(a) * (x - a)) + f(a)
AI Drawing Prompt Reference
Draw a graph of the function f(x)=((x-1)*(x+1)*(x-3)). Mark a point A on the graph that can be moved. Draw a tangent line at point A. Observe how the tangent line changes as point A moves. Highlight the relationship between the slope of the tangent line and the derivative of the function at point A. The graph should clearly show the function curve, the tangent line, and the position of point A.
The prompt above was compiled from the original drawing commands and is for reference only.