
Gradient-Intercept Form of a Line: y=mx+b
Loading the math board and drawing, please wait…
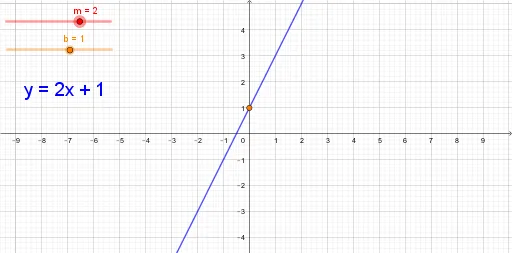
This GeoGebra example visually demonstrates the gradient-intercept form of a linear equation, y = mx + b. Users can adjust the slope (m) and y-intercept (b) via sliders to observe real-time changes in the line's steepness and position. The construction employs the Intersect command and involves objects including the slope parameter m, intercept parameter b, function graph f, text label, and intersection point A. Core mathematical concepts covered include linear functions, slope, intercept, coordinate geometry, and similar triangles. It is suitable for middle school and high school algebra, coordinate geometry, and introductory mathematics courses focusing on linear relationships and parameter variation.
GeoGebra Commands & Parameters
Intersect(f, yAxis) → A
AI Drawing Prompt Reference
Create a coordinate-plane diagram illustrating the gradient–intercept form of a line, y = mx + b. Include two adjustable parameters that control the slope m and the y-intercept b, so the drawn line updates in real time as m and b change. Display the line as a function graph and visually emphasize the intersection of the line with the y-axis; this intersection point represents the y-intercept. Add a clear on-figure label indicating the equation or parameter meaning, focusing on the relationship between slope/steepness and the line’s position on the y-axis.
The prompt above was compiled from the original drawing commands and is for reference only.