
Grade Point Average Calculation Problems
Loading the math board and drawing, please wait…
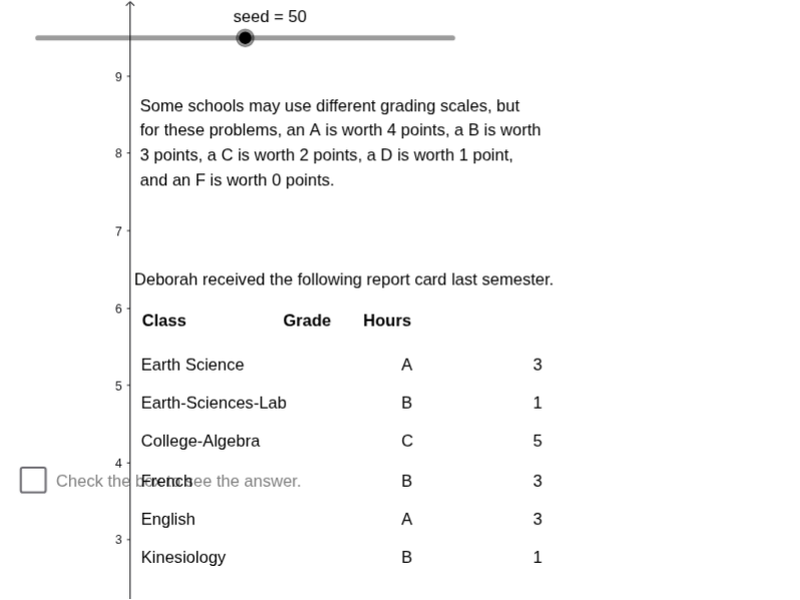
This GeoGebra applet presents multiple semester grade reports and asks students to calculate the grade point average in each case. The core mathematical concepts involved include arithmetic mean and statistics. Construction highlights include the use of commands such as Mod, If, Sum, Sequence, Join, etc. Suitable for high school math education and student practice.
GeoGebra Commands & Parameters
Mod(seed, 4) → SmallOptIf(Mod[seed, 2] ≟ 0, 5, 4) → LCredSum(CrdSq0) → CredSum0If(CredSum0 < 12, 2, 1) → StanNoSequence(3, k, 1, StanNo) → FnlCrdJoin({CrdSq0, FnlCrd}) → CrdSq1Sum(CrdSq1) → CredSum1If(CredSum0 > 17 ∨ SmallOpt ≟ 0, 0, If[SmallOpt > 1, 1, 2]) → SmallCredIf(SmallCred > 0, Join[{CrdSq1, {SmallCred}}], CrdSq1) → CrdSq2Sum(CrdSq2) → CredSum2CountIf(x > 0, CrdSq2) → NoClassesSequence(If[sin(10000 + ((k * 1000) * seed)) > 0.5, 4, If[sin(10000 + ((k * 1000) * seed)) < -0.5, 2, 3]], k, 1, NoClasses) → GrdPtSqSequence((Element[GrdPtSq, k] * Element[CrdSq2, k]), k, 1, NoClasses) → PrdSqSum(PrdSq) → PtTotElement(LrgSq, Mod[seed, 2] + 1) → LargeElement(SciSq, Mod[seed, 4] + 1) → ScienceElement(LbSq, Mod[seed, 4] + 1) → LabElement(LngSq, Mod[seed, 5] + 1) → LangSequence(Element[StnClsSq0, Mod[Mod[seed, 6] + (k * Mod[seed, 101]), 8] + 1], k, 0, StanNo - 1) → StnClsSq1If(CredSum1 > 17 ∨ SmallOpt ≟ 0, {}, {Element[SmlSq, SmallOpt]}) → SmlElement(NamSq, OptNo) → StudentJoin({ClsSq0, StnClsSq1, Sml}) → ClsSq1Sequence(Element[GrdSq0, Element[GrdPtSq, k] + 1], k, 1, NoClasses) → GrdSq1Sequence("(", k, 1, NoClasses) → LfPrSqSequence(")", k, 1, NoClasses) → RtPrSqSequence("x", k, 1, NoClasses) → MltSqSequence("=", k, 1, NoClasses) → EqSqIf(OptNo ≟ 7, "'", "'s") → PossSequence(Text[Element[ClsSq1, k], (0.15, 5.7 - (0.5 * k))], k, 1, NoClasses) → ClsSqTxSequence(Text[Element[GrdSq1, k], (3.5, 5.7 - (0.5 * k))], k, 1, NoClasses) → GrdSqTxSequence(Text[Element[GrdPtSq, k], (4.2, 5.7 - (0.5 * k))], k, 1, NoClasses) → GrdPtSqTx1Sequence(Text[Element[LfPrSq, k], (4, 5.7 - (0.5 * k))], k, 1, NoClasses) → LfPrSqTxSequence(Text[Element[RtPrSq, k], (4.5, 5.7 - (0.5 * k))], k, 1, NoClasses) → RtPrSqTxSequence(Text[Element[CrdSq2, k], (5.2, 5.7 - (0.5 * k))], k, 1, NoClasses) → CrdSqTx1Sequence(Text[Element[CrdSq2, k], (6.6, 5.7 - (0.5 * k))], k, 1, NoClasses) → CrdSqTx2Sequence(Text[Element[GrdPtSq, k], (6, 5.7 - (0.5 * k))], k, 1, NoClasses) → GrdPtSqTx2Sequence(Text[Element[MltSq, k], (6.3, 5.7 - (0.5 * k))], k, 1, NoClasses) → MltSqTxSequence(Text[Element[EqSq, k], (6.9, 5.7 - (0.5 * k))], k, 1, NoClasses) → EqTxSqSequence(Text[Element[PrdSq, k], (7.2, 5.7 - (0.5 * k))], k, 1, NoClasses) → PrdSqTx
AI Drawing Prompt Reference
Create a grade report layout with multiple rows, each showing a course name, letter grade, grade point value, credit hours, multiplication sign, equals sign, and the product on the right. Include a student name and semester header at the top, and a summary area at the bottom for total credits and total points. Course names are randomly selected from preset lists, with some rows marked as standard or small courses. Arrange all text in a neat table format for GPA calculation practice.
The prompt above was compiled from the original drawing commands and is for reference only.