
Geometric Visualization of the Derivative of an Inverse Function
Loading the math board and drawing, please wait…
In collections
Trigonometry - Unit Circle Exact ratios
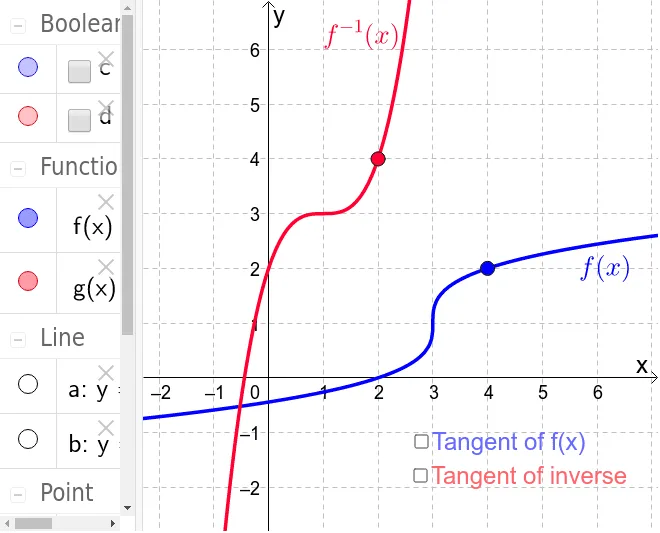
This GeoGebra example geometrically visualizes the reciprocal relationship between the derivatives of a function and its inverse at symmetric points across the line $y=x$. The core mathematical concepts covered include inverse functions, derivatives, tangent lines, slopes, and the inverse function theorem. To construct this visualization, the `Function` command is used to define the function $f$ and its inverse $g$, the `Point` command is applied to mark corresponding points $A$ and $B$, and the `Tangent` command generates the tangent lines at these key points to illustrate the slopes dynamically. Text labels are added to show the algebraic relations. This tool is highly suitable for calculus classrooms, university-level mathematics courses, or high school advanced placement classes to build geometric intuition for the derivative rule of inverse functions.
GeoGebra Commands & Parameters
Function((x - 3)^(1 / 3) + 1, -100, 100) → fFunction((x - 1)^(3) + 3, -100, 100) → gPoint(f) → ATangent(x(A), f) → aTangent(x(B), g) → b
AI Drawing Prompt Reference
Draw the graph of f(x)=∛(x-3)+1 and its inverse g(x)=(x-1)^3+3. Choose a point on f, draw its tangent line; then take the point on g that is symmetric to the chosen point across the line y=x, and draw the tangent there. The two tangents have reciprocal slopes, illustrating the derivative relationship for inverse functions, clearly showing the reciprocal nature of the derivatives at corresponding points.
The prompt above was compiled from the original drawing commands and is for reference only.