
Geometric Representation of Inequalities
Loading the math board and drawing, please wait…
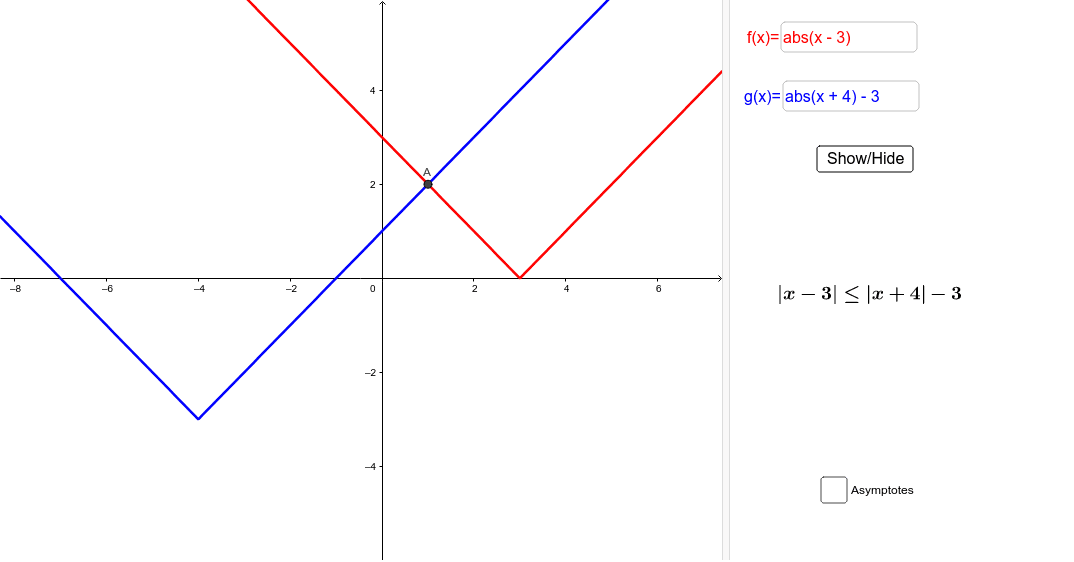
This example demonstrates the geometric representation of inequalities, visually showing the solution set ranges through graphical intersections. Core math concepts include inequalities, function graphs, and geometric intersection points. Construction highlights involve GeoGebra commands like Textfield, Intersect, Asymptote, OrthogonalLine, and objects such as functions f, g, input boxes, intersection points, asymptotes. Suitable for high school and above learners to understand the connection between inequalities and geometric shapes, enhancing visual analysis skills.
GeoGebra Commands & Parameters
Textfield(f) → inputBox1Textfield(g) → inputBox2Intersect(f, g, -50, 50) → A, B, K, L, M, N, O, P, Q, R, S, T, C, U, V, W, Z, A_1, B_1, C_1, D_1, E_1, F_1, D, G_1, E, F, G, H, I, JAsymptote(f) → list1Asymptote(g) → list2OrthogonalLine(A, xAxis) → aOrthogonalLine(B, xAxis) → bOrthogonalLine(C, xAxis) → cOrthogonalLine(D, xAxis) → dOrthogonalLine(E, xAxis) → eOrthogonalLine(F, xAxis) → hOrthogonalLine(G, xAxis) → iOrthogonalLine(H, xAxis) → jOrthogonalLine(I, xAxis) → kOrthogonalLine(J, xAxis) → lOrthogonalLine(K, xAxis) → mOrthogonalLine(L, xAxis) → nOrthogonalLine(M, xAxis) → pOrthogonalLine(N, xAxis) → qOrthogonalLine(O, xAxis) → rOrthogonalLine(P, xAxis) → sOrthogonalLine(Q, xAxis) → tOrthogonalLine(R, xAxis) → a_1OrthogonalLine(S, xAxis) → b_1OrthogonalLine(T, xAxis) → c_1OrthogonalLine(U, xAxis) → d_1OrthogonalLine(V, xAxis) → e_1OrthogonalLine(W, xAxis) → f_1OrthogonalLine(Z, xAxis) → g_1OrthogonalLine(A_1, xAxis) → h_1OrthogonalLine(B_1, xAxis) → i_1OrthogonalLine(C_1, xAxis) → j_1OrthogonalLine(D_1, xAxis) → k_1OrthogonalLine(E_1, xAxis) → l_1OrthogonalLine(F_1, xAxis) → m_1OrthogonalLine(G_1, xAxis) → n_1
AI Drawing Prompt Reference
Draw the graphs of two functions, showing their intersection points, and draw vertical lines from the x-axis through these points, also plot the asymptotes of the functions to demonstrate the geometric representation of inequalities and the relationship between function graphs and intersection points.
The prompt above was compiled from the original drawing commands and is for reference only.