
Geometric Illustration of the Derivative of a Power Function
Loading the math board and drawing, please wait…
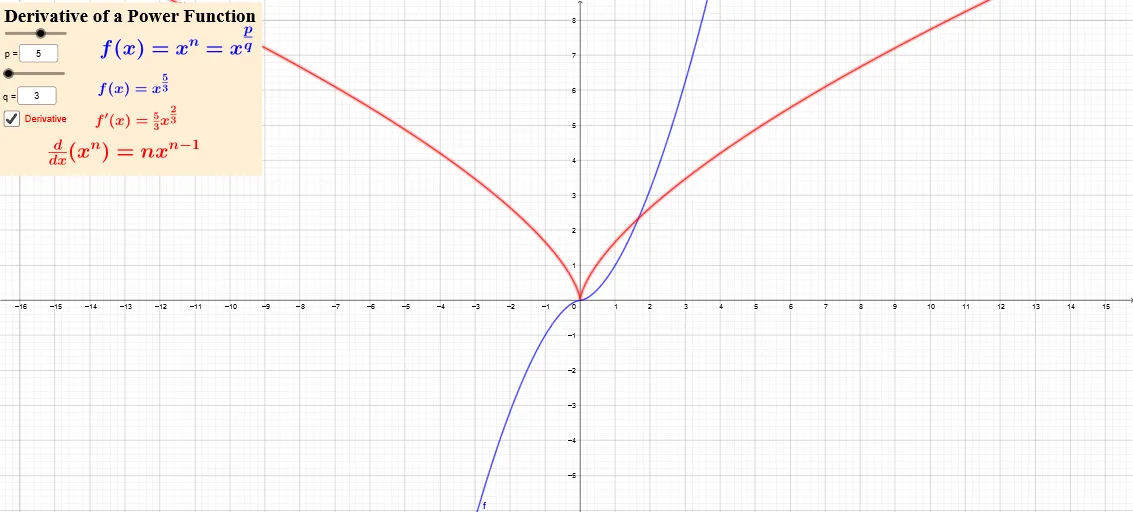
This GeoGebra example demonstrates how a power function and its derivative change when key parameters (such as the exponent p and coefficients) are varied. It visualizes the relationship between the function f(x) (e.g., a·x^p-like form) and its derivative f′, highlighting how the derivative represents the instantaneous rate of change. The core concepts are power functions, differentiation, and the dependence of graph shape on parameters (exponent and scaling/translation factors). Construction-wise, the setup relies on Textfield and multiple input fields (e.g., p, q, a, g, b) to enter parameters and display labels, while creating function-related objects for f and f′ so the graphs update consistently under parameter changes. Suitable for high school advanced calculus review and early university calculus, it helps learners connect derivative formulas with graphical behavior and supports exploratory understanding of slopes and rates.
GeoGebra Commands & Parameters
Textfield(p) → InputBox1Textfield(q) → InputBox2
AI Drawing Prompt Reference
Draw a power function and its derivative, with the function form as a·x^p. Use input boxes to enter p and q to adjust the exponent and coefficient of the function. First enter p, then enter q, and observe how the function graph and its derivative graph change, to understand how the derivative represents the instantaneous rate of change.
The prompt above was compiled from the original drawing commands and is for reference only.