
Geometric Distribution by Dr Brooks
Loading the math board and drawing, please wait…
In collections
statistics
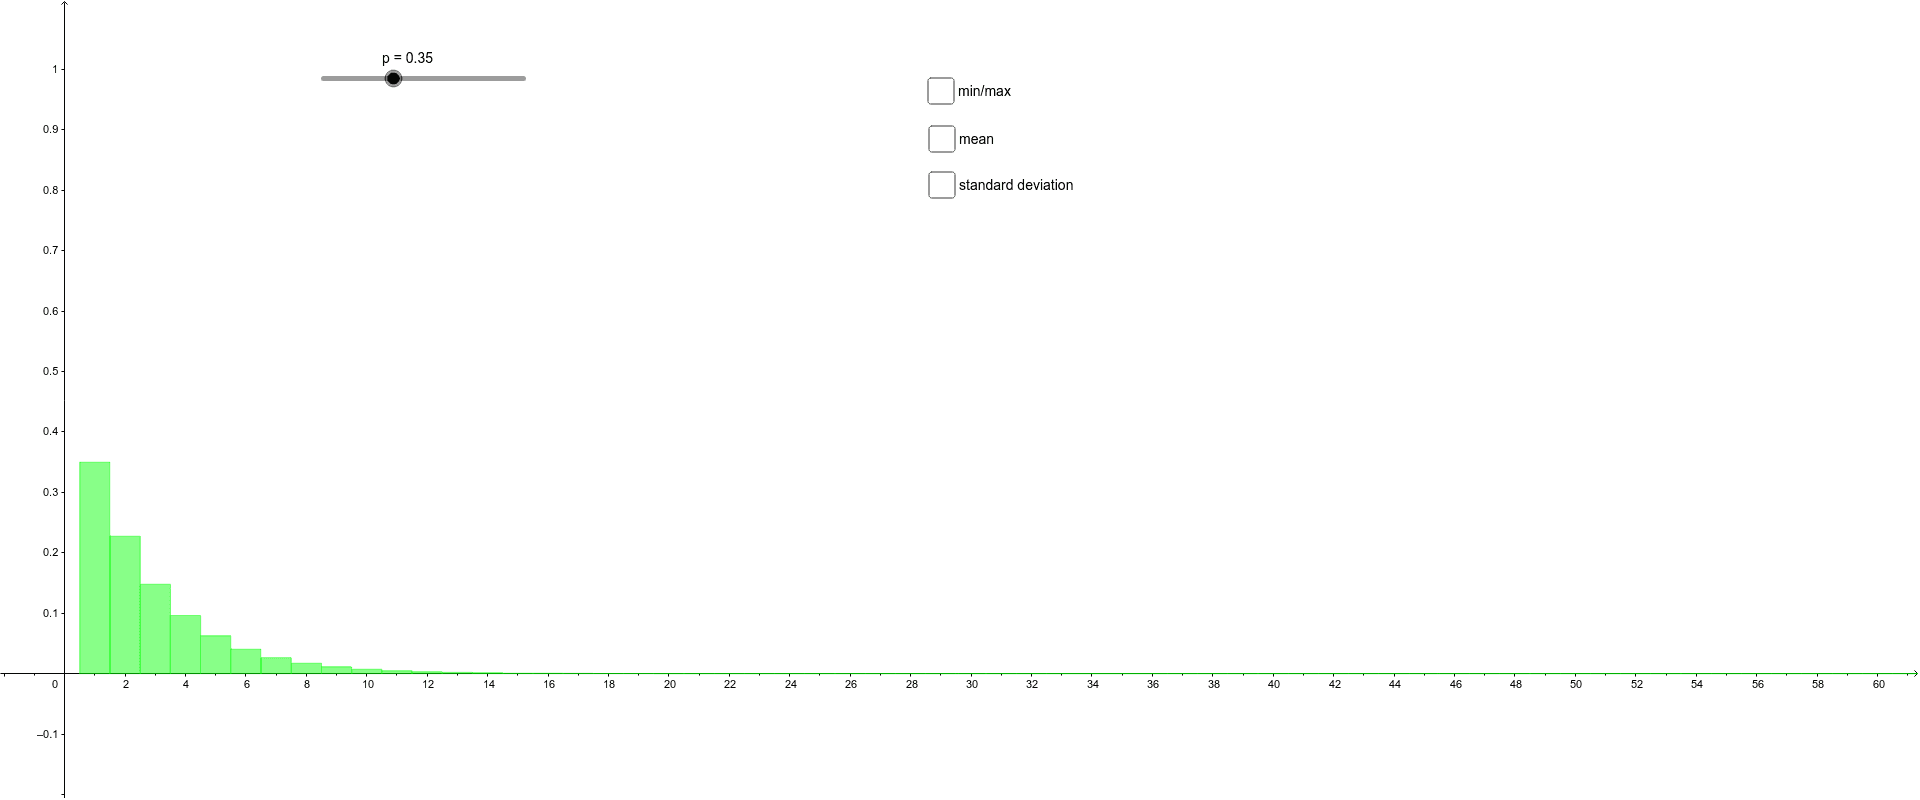
This example demonstrates the probability distribution of a geometric distribution. A geometric distribution describes the number of trials needed to get the first success in a series of independent Bernoulli trials. By adjusting parameters, you can observe how the distribution changes. The Pascal command is used to generate the geometric distribution, and the BarChart command is used to plot the distribution. Suitable for high school probability and statistics courses.
GeoGebra Commands & Parameters
Pascal(1, p) → aBarChart((-0.5) + min, 0.5 + max, Sequence[(p * (1 - p)^(k - 1)), k, min, max]) → bBarChart(0.5, 100.5, Sequence[(p * (1 - p)^(k - 1)), k, 1, 100]) → c
AI Drawing Prompt Reference
Create a geometric distribution probability histogram with parameter p set to 0.5, showing results from 1 to 100 trials. First, generate the geometric distribution sequence, then use the BarChart command to plot the histogram.
The prompt above was compiled from the original drawing commands and is for reference only.