
Geometric Definition of the Derivative at a Point
Loading the math board and drawing, please wait…
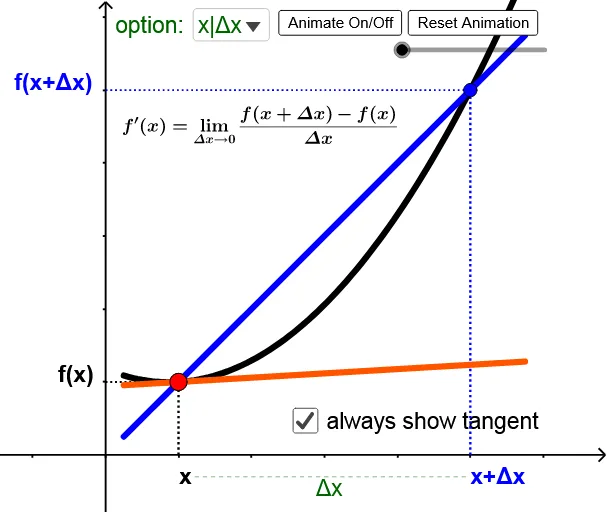
This example demonstrates how the derivative of a function at a point is obtained geometrically: the slope of a secant line changes as the second point approaches the given point, and in the limit it converges to the slope of the tangent line. The key ideas are the pointwise definition of the derivative, the relationship between secant/tangent lines, and the use of similar triangles to interpret slope-related quantities as measurable geometric ratios. Construction relies on GeoGebra commands such as Tangent (to build the tangent line), Line (to create the secant line), Segment (to form the line segments used in the slope/similarity reasoning), SelectedIndex (to pick and update the active indices/points), and If/Element (to control conditional object selection and updates). Text labels (e.g., parameter and function annotations) are added to show the current values while using animation/reset controls (btnAnimate, btnReset, and show toggles) so learners can visually track the “secant-to-tangent” convergence. Suitable for calculus instruction and understanding derivatives and limits through geometric intuition.
GeoGebra Commands & Parameters
Tangent(P_1, f) → l_{tan}Line(P_{1S}, P_{2S}) → l_{sec}SelectedIndex(opt) → opt_iSegment((pt_{1A}, 0), (pt_{1A}, f(pt_{1A}))) → seg_aSegment((x_a, 0), (x_a, f(x_a))) → seg_xSegment((0, f(pt_{1A})), (pt_{1A}, f(pt_{1A}))) → seg_{fa}Segment((0, f(x_a)), (x_a, f(x_a))) → seg_{fx}If(opt_i ≤ 2, "a", "x") → txt_{ax}Element(opt_2, opt_i) → txt_{xhd}Text(txt_{ax}, (pt_{1A}, pos_y)) → text_{ax}Text("f(" + txt_{ax} + ")", ((0.65 * pos_x), f(pt_{1A}))) → text_{f(ax)}Text(If[opt_i > 1, txt_{ax} + "+"] + txt_{xhd}, (x_a, pos_y)) → text_{xhd}Text("f(" + text_{xhd} + ")", ((1.25 * pos_x), f(x_a))) → text_{f(xhd)}Segment((pt_{1A}, (0.75 * pos_y)), (x_a, (0.75 * pos_y))) → delta
AI Drawing Prompt Reference
In a single coordinate plane, take a function f and a point P_1 on its graph. Construct the tangent line to the curve at P_1, and also draw a secant line through two nearby points (P_1S and P_2S). Mark two x-positions, one at pt_1A and another at x_a, and from each x-position draw vertical segment(s) up to the curve to show f(pt_1A) and f(x_a) as heights above the x-axis. Build corresponding segments from the x-axis to the curve level at those positions, keeping the geometric setup consistent with slope interpretation. Add clear text labels for the current x-parameter and for function values f(...) so the notation updates with the selected configuration. Finally, draw a horizontal segment delta between the two chosen x-positions to represent the horizontal change used in the “secant-to-tangent” viewpoint.
The prompt above was compiled from the original drawing commands and is for reference only.