
Arithmetic & Geometric End Behavior
Loading the math board and drawing, please wait…
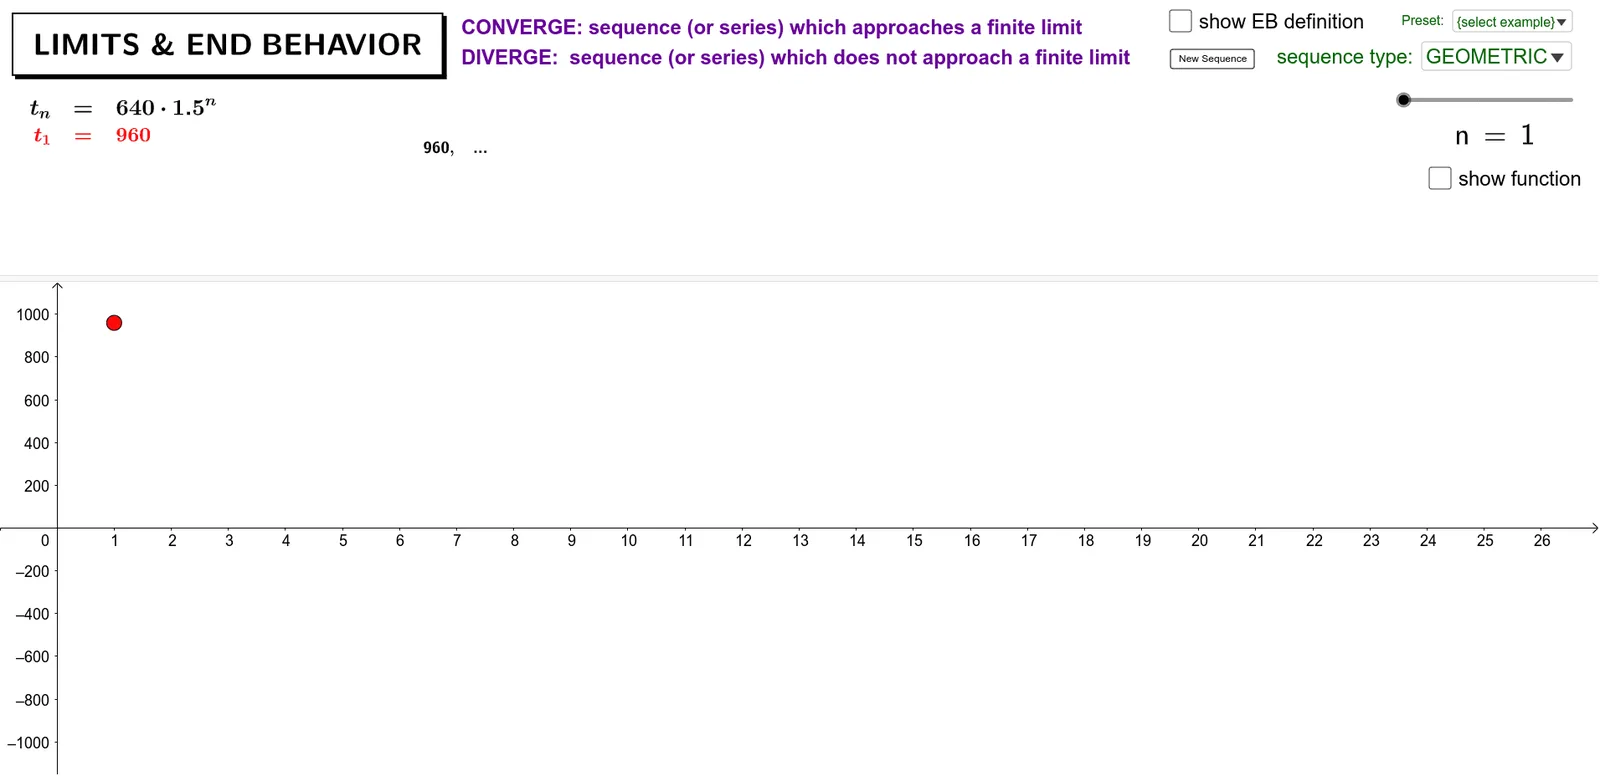
This example illustrates the end behavior of arithmetic and geometric sequences. Key mathematical concepts include arithmetic and geometric sequences and their limits. Using GeoGebra commands such as If, Random, and Simplify, dynamic sequence graphs are constructed. Suitable for high school math education to help students understand the concept of sequence limits.
GeoGebra Commands & Parameters
If(SelectedElement[type] ≟ 1, 0.5, 0.25) → rnd_{neg}If(abs(b_1 / b_2) ≟ 1, Random[3, 10] / 2, b_1 / b_2) → bRandom(1, 3) → power_{rnd}Simplify((a * ((a_2 * b_2))^(power_{rnd}))) → geo_aSimplify((a_1 * x) + b_1) → ariIf(SelectedIndex[type] ≟ 1, ari, geo) → tIf(Max[absendvalues] < 1, 1, Max[absendvalues]) → y_{mx}If(SelectedIndex[type] ≟ 1, 51, Min[26, -1 + floor(abs(log(abs(b), abs(5000000 / (a)))))]) → n_{smax}LaTeX(n, true, true) → tn_1If(n < 100, 1, 10^(Div[n_S - 1, 9] - 1)) → stepSequence((i * step), i, 1, n / step) → plot_xUnion(Sequence[Point[{i, t(i)}], i, 1, If[n > 10, 10, n]], Sequence[Point[{(i * step), t((i * step))}], i, 1, n / step]) → plotsIf(SelectedIndex[type] ≟ 2, If[abs(b) < 1, "0", If[b < 0, "DNE", If[a > 0, "∞", "-∞"]]], If[a_1 > 0, "∞", "-∞"]) → limitTableText(Sequence[If[FractionText[t(i)] ≠ Text[t(i)], (FractionText[t(i)] * ",\,"), ""], i, 1, If[n ≤ 10, n, 10]], {"\\"}, Join[{Sequence[(round(t(i), 6) * ",\,"), i, 1, If[n ≤ 10, n, 10]], {"..."}}]) → text3SelectedIndex(examples) → exampleIndexElement(videxamples, exampleIndex) → exampleElement
AI Drawing Prompt Reference
Create a dynamic graph illustrating the end behavior of arithmetic and geometric sequences. The graph shows two switchable sequence types: an arithmetic sequence as a straight line and a geometric sequence as an exponential curve. Discrete points represent sequence terms, with the first ten points as solid dots and later points as hollow dots spaced by a step. Above the graph, display the limit value (e.g., 0, infinity, or does not exist). Below, a table lists the first few terms as exact fractions and rounded decimals. The vertical axis auto-scales to fit the curve. The layout is clean, suitable for high school teaching on sequence convergence and divergence.
The prompt above was compiled from the original drawing commands and is for reference only.