
Geometric Construction of a Venn Diagram with Intersecting Circles
Loading the math board and drawing, please wait…
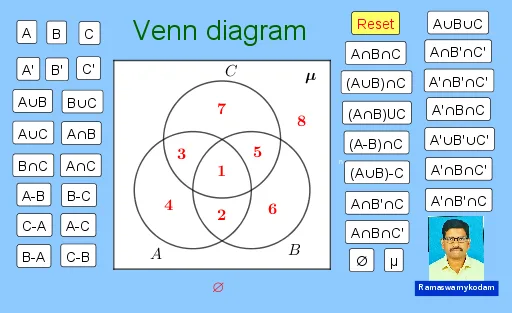
This example demonstrates how to construct a Venn diagram in GeoGebra by overlapping circles to visualize set relationships such as intersection, union, and set difference. It emphasizes core concepts from set theory: how the common region of circles corresponds to the intersection, how the combined covered regions represent the union, and how subtracting one set from another corresponds to removing parts of the overlap. The construction is carried out using standard geometric commands: Circle to create the circles, Line and OrthogonalLine for auxiliary straight-line geometry, Intersect to compute intersection points of circles/lines, Tangent to generate tangency elements when needed, CircleSector for arc-based markings, Segment and Polygon to outline or fill regions, and Midpoint/Center to locate key points like midpoints and circle centers. It also uses text labels and interactive buttons to guide the viewer through the diagram’s meaning. The construction supports classroom instruction for middle and high school learners and is suitable for interactive demonstrations in math education and GeoGebra geometry activities.
GeoGebra Commands & Parameters
Circle(A, B) → cCircle(B, A) → dSegment(A, B) → fCircle(A, f + 0.7) → eCircle(B, f + 0.7) → gOrthogonalLine(A, f) → hIntersect(e, h) → C, DIntersect(c, d) → E, F, ,Tangent(C, e) → j,Line(A, B) → kIntersect(e, k) → G, HIntersect(g, k) → I, JOrthogonalLine(G, f) → lOrthogonalLine(J, k) → m_2Intersect(j, l) → MIntersect(m_2, j) → NCircleSector(B, E, F) → pCircleSector(A, F, E) → qPolygon(A, B, 3) → poly1, i, n, r, KCircle(E, A) → sCircle(E, f + 0.7) → tLine(F, E) → bIntersect(t, b) → L, OTangent(O, t) → f_1,Intersect(l, f_1) → PIntersect(m_2, f_1) → QPolygon(M, N, Q, P) → q1, m_1, n_1, q_1, p_1Intersect(c, d, 1) → RMidpoint(E, Q) → SMidpoint(S, Q) → TMidpoint(M, A) → UMidpoint(M, U) → VMidpoint(B, N) → WMidpoint(W, N) → ZIntersect(c, s) → A_1, B_1, ,Intersect(d, s) → C_1, D_1, ,CircleSector(A, B, A_1) → c_1CircleSector(E, A_1, B) → d_1CircleSector(B, D_1, A) → e_1CircleSector(E, A, D_1) → g_1CircleSector(B, E, A) → h_1CircleSector(E, A, B) → k_1CircleSector(A, B, E) → r_1Circle(A, B) → s_1Circle(B, A) → t_1Circle(E, B) → c_2Segment(M, N) → i_1Segment(Q, N) → j_1Segment(Q, P) → l_1Segment(P, M) → a_1Center(h_1) → E_1Center(h_1) → F_1Center(h_1) → G_1Midpoint(E, L) → H_1Midpoint(H_1, D_1) → I_1Midpoint(H_1, A_1) → J_1Midpoint(E, O) → K_1Midpoint(A, U) → L_1Midpoint(W, B) → M_1Midpoint(H, T) → N_1Midpoint(i_1) → m
AI Drawing Prompt Reference
Draw two intersecting equal circles with their centers joined as a base segment. At each center erect a perpendicular line, then draw larger concentric circles whose radii exceed the original by 0.7 units. The larger circles meet the perpendiculars at four points; draw tangents through those points, which intersect the perpendiculars to form a quadrilateral. Shade the lens-shaped intersection of the original circles with circular sectors, construct an equilateral triangle on the base segment, and add further sector markings at the triangle vertices and along the center lines to indicate angles.
The prompt above was compiled from the original drawing commands and is for reference only.