
Geometric and Negative Binomial Distributions
Loading the math board and drawing, please wait…
In collections
Pearson Maths A level Further Statistics 1
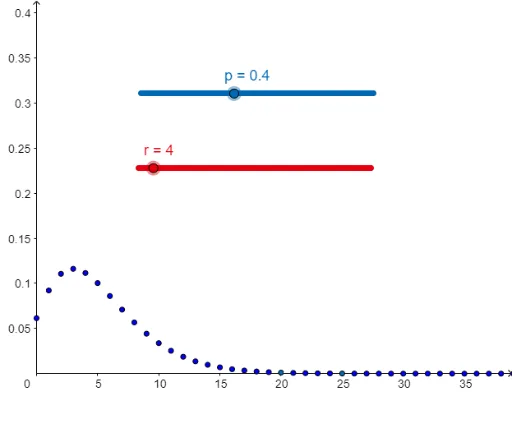
This example demonstrates how to visualize geometric and negative binomial distributions using GeoGebra. It involves core math concepts like probability & statistics, distribution properties, and calculations of mean and variance. The construction uses commands like FractionText and multiple objects (D103-D70) to represent the distributions. Suitable for high school and above, helping learners understand discrete probability distributions visually and through parameter manipulation.
GeoGebra Commands & Parameters
FractionText(p_1) → n_{1}
AI Drawing Prompt Reference
Draw the graphs of geometric and negative binomial distributions. First, set a parameter p to represent the probability of success. Use FractionText to display p as a fraction n₁. Then, observe how the distributions change by adjusting p, to understand the properties of discrete probability distributions.
The prompt above was compiled from the original drawing commands and is for reference only.