
Geometric and Function Construction Example: Power Function and Rectangle Diagra
Loading the math board and drawing, please wait…
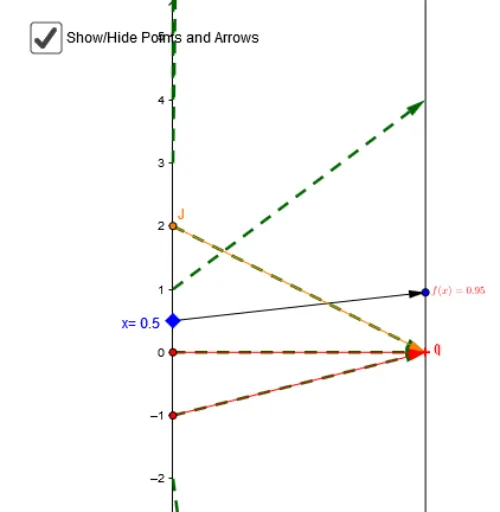
This example demonstrates constructing power function graphs and rectangle diagrams using GeoGebra, along with tree diagrams to illustrate function value calculations. Key mathematical concepts include power functions, rectangle geometry, and tree structures. Construction involves using commands like Root, Point, Textfield to create function objects, coordinate points, and text annotations. Suitable for middle to high school students learning function graphing and geometric construction techniques.
GeoGebra Commands & Parameters
Root(f) → B, D, GPoint(yAxis) → ATextfield(f) → inputBox1Vector(H, F) → wVector(C, I) → vSequence(num) → NVector(A, E) → uZip((k, f(k)), k, N - num / 2) → list3Zip(Vector[(0, k), (2, f(k))], k, N - num / 2) → list2Vector(J, G) → c
AI Drawing Prompt Reference
Draw a graph of a power function and a rectangle diagram. The power function graph should show the trend of function values with the variable, and the rectangle diagram should illustrate the relationship between function values and rectangle area. Construct by first drawing the power function graph, then the rectangle diagram, ensuring clear relationships.
The prompt above was compiled from the original drawing commands and is for reference only.