
Geographic Coordinates and Time
Loading the math board and drawing, please wait…
In collections
On Sphere
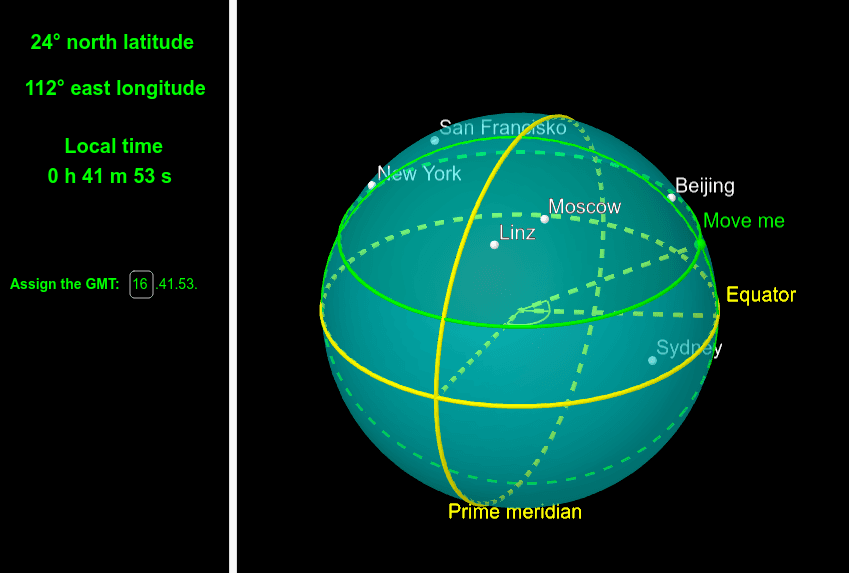
This example demonstrates the relationship between geographic coordinates and time. It involves core mathematical concepts such as coordinate systems, functions, and calculus. Using GeoGebra commands like Intersect, Point, Sphere, etc., it dynamically shows how geographic coordinates change over time. Suitable for high school and above students learning coordinate geometry and calculus.
GeoGebra Commands & Parameters
Intersect(xAxis, yAxis) → AIntersect(zAxis, xOyPlane) → BPoint(zAxis) → CSphere(A, 2) → aPointIn(a) → DPoint(zAxis) → ECircle(C, D, E) → cPlane(D, xOyPlane) → bIntersectPath(b, a) → dCircle(C, E, (2, 0, 0)) → eCircle((2, 0, 0), (0, 2, 0), (0, -2, 0)) → fIntersectIntersect(c, f) → F, G, ,Segment(A, F) → gAngle(g, xAxis) → αSegment(A, D) → hAngle(g, h) → βSegment(A, (2, 0, 0)) → iElement(t, 3) → minElement(t, 2) → sekIf(y(D) ≥ 0, gmt + floor(α / (π / 12)), gmt - floor(α / (π / 12))) → hourlTextfield(gmt) → InputBox1