
GeoGebra Least Squares Regression Line Equation
Loading the math board and drawing, please wait…
In collections
Linear Regression Things
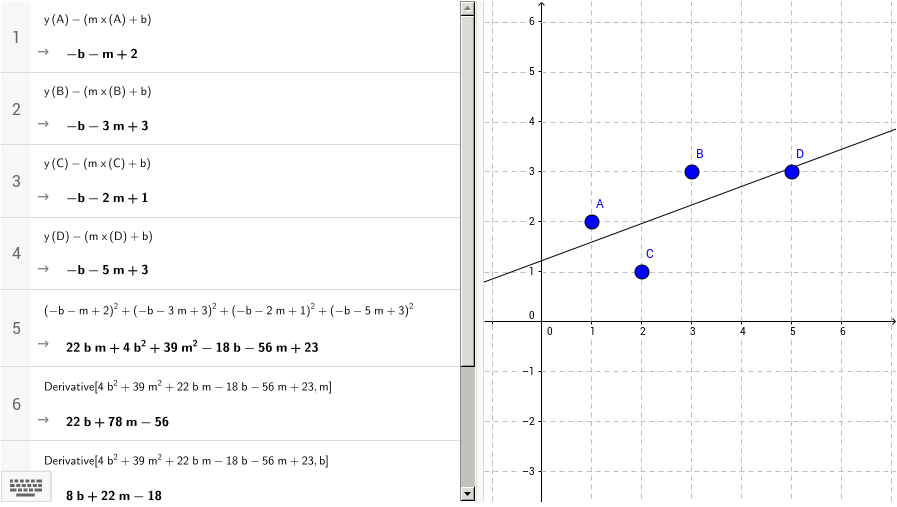
This example demonstrates how to find the equation of the Least Squares Regression Line using GeoGebra. Key mathematical concepts include linear regression, coordinate systems, and data fitting. Construction involves using objects A, B, C, D, and parameter a to plot data points and calculate the equation. Suitable for high school students or college freshmen learning statistics and geometric applications.
GeoGebra Commands & Parameters
Point A(1.0, 2.0)Point B(3.0, 3.0)Point C(2.0, 1.0)Point D(5.0, 3.0)Line a(-0.37142857142857144, 1.0, -1.2285714285714286)
AI Drawing Prompt Reference
Plot four data points at coordinates (1,2), (3,3), (2,1), and (5,3) on a coordinate plane. Then draw the least squares regression line that best fits these points, with an approximate equation y = 0.3714x + 1.2286. The line should pass through the central trend of the points and be clearly visible on the grid.
The prompt above was compiled from the original drawing commands and is for reference only.