
GeoGebra Grid Construction Example
Loading the math board and drawing, please wait…
In collections
Fatin Uluengin - muqarnas
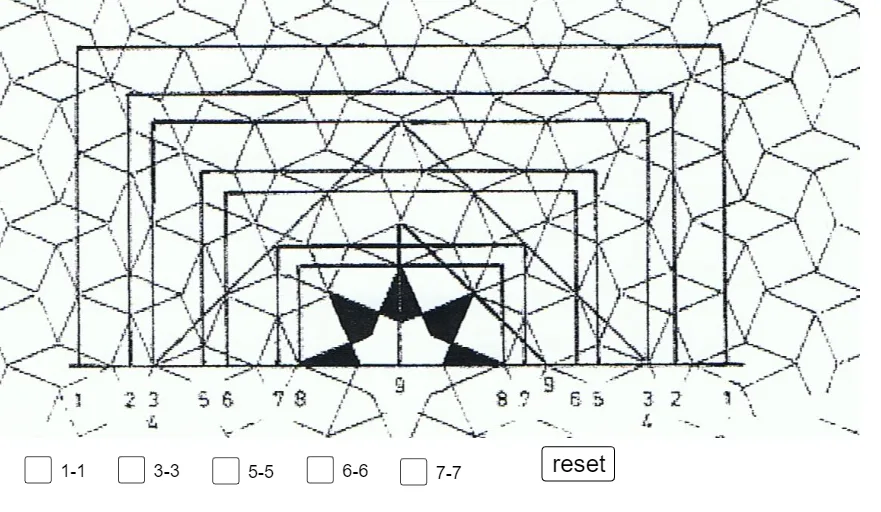
This GeoGebra example demonstrates the construction of a mathematical grid, aimed at visualizing various mathematical curves such as trigonometric functions and parabolas. The core mathematical concepts involved include limits, trigonometric functions, parabolas, linear equations, and rotation. The construction utilizes Point and Polygon commands to create multiple points and polygons, forming a grid structure that aids in the visualization of these concepts. It is suitable for educational purposes in high school or university settings, particularly for teaching function graphing, geometric transformations, and coordinate geometry.
GeoGebra Commands & Parameters
Point(xAxis) → CPoint(xAxis) → FPoint(xAxis) → GPoint(xAxis) → HPoint(xAxis) → JPoint(xAxis) → KPoint(xAxis) → LPoint(xAxis) → MPoint(xAxis) → NPoint(xAxis) → OPoint(xAxis) → PPoint(xAxis) → QPoint(xAxis) → RPoint(yAxis) → H_1Point(xAxis) → I_1Polygon(C, D, E, F) → vierhoek1, c, d, e, fPolygon(G, T, U, R) → vierhoek2, g, t, u, rPolygon(H, V, W, Q) → vierhoek3, h, v, w, qPoint(yAxis) → J_1Polygon(H, J_1, Q) → driehoek1, q_1, h_1, j_1Polygon(I, Z, A_1, P) → vierhoek4, i, z_1, a_1, pPolygon(J, B_1, C_1, O) → vierhoek5, j, b_1, c_1, oPolygon(K, D_1, E_1, N) → vierhoek6, k, d_1, e_1, nPolygon(L, F_1, G_1, M) → vierhoek7, l, f_1, g_1, mPolygon(I_1, H_1, S) → driehoek2, s, i_1, a
AI Drawing Prompt Reference
Draw a mathematical grid with points, rectangles, and triangles. The points are distributed along the x-axis and y-axis. Rectangles and triangles are connected using these points to form a grid structure. Ensure the grid is clear for understanding mathematical concepts.
The prompt above was compiled from the original drawing commands and is for reference only.