
Geogebra Example: Polynomial Functions and Graphs
Loading the math board and drawing, please wait…
In collections
Mapping Diagrams: From AB to C&DE, Resource
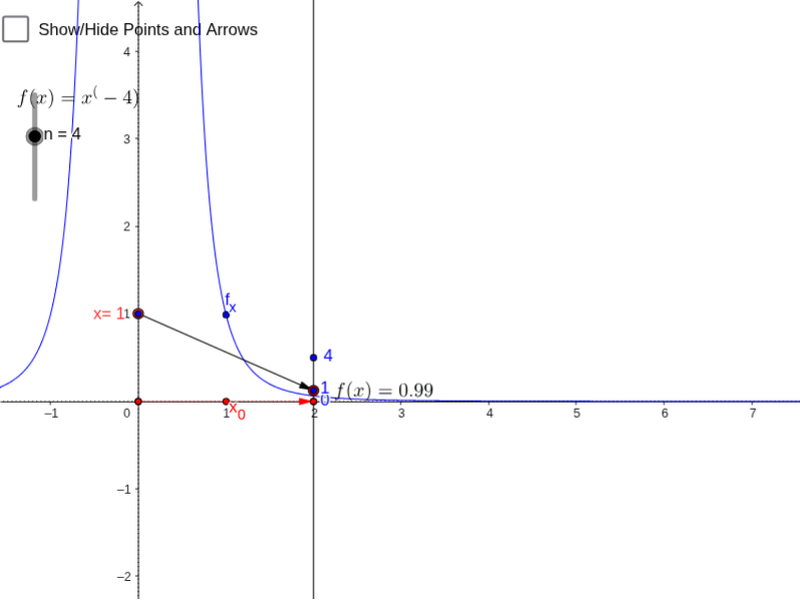
This example demonstrates the graphing of polynomial functions and their relationship with derivatives, vectors, and other mathematical elements. Core concepts include polynomial functions, derivatives, vectors, coordinate geometry, and function graphing. It uses commands like Point, Vector, Textfield, and Sequence. Suitable for high school and above learners to understand function properties and geometric representations.
GeoGebra Commands & Parameters
Point(yAxis) → AVector(A, B) → uTextfield(f) → inputBox1Sequence((i, f(i)), i, -4, 4, 1) → list3Vector((0, 0), (2, 0)) → vSequence(Vector[(0, i), (2, f(i) / 8)], i, -4, 4, 1) → list2Vector(H, I) → wVector(J, K) → z