
GeoGebra Example LF 2.5
Loading the math board and drawing, please wait…
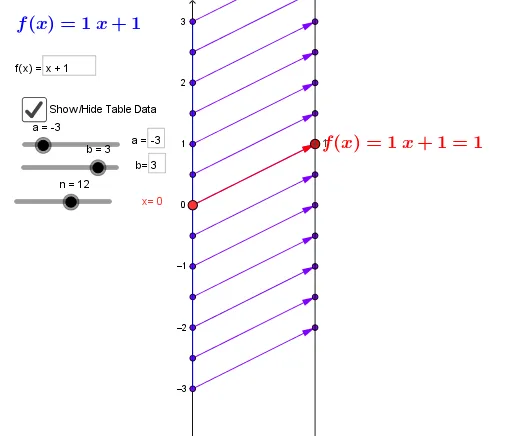
This example demonstrates mathematical concepts such as correlation, pie charts/circle charts, hyperbolas, polynomial functions, and median values. Core math concepts include correlation analysis, data visualization, analytical geometry, and function graphing. It utilizes GeoGebra commands/objects like Point, Vector, Textfield, Sequence, and Segment. Suitable for high school and above mathematics education or self-learning to understand complex mathematical relationships and graphical representations.
GeoGebra Commands & Parameters
Point(yAxis) → A_1Vector(A_1, B) → uTextfield(f) → inputBox1Textfield(f) → inputBox2Textfield(a) → inputBox3Textfield(b) → inputBox4Sequence((k, f(k)), k, a, b, Δx) → GraphptsSequence(Vector[(0, k), (2, (y_{zoom} * f(k)))], k, a, b, Δx) → MDSequence((0, k), k, a, b, Δx) → SourcePtsMDSequence((2, (y_{zoom} * f(k))), k, a, b, Δx) → TargPts_1Segment((0, a), (0, b)) → c