
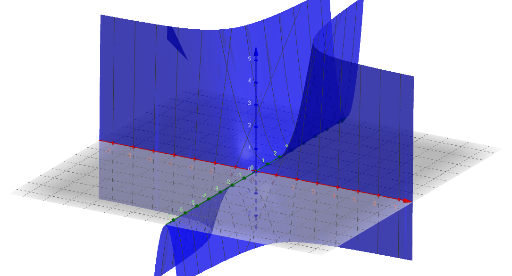
GeoGebra Demonstration of z=yx^2
Loading the math board and drawing, please wait…
In collections
Parabola Assignment
This example dynamically demonstrates the 3D graph of the function z=yx^2 using GeoGebra, showing how the graph changes with variations in parameters y and x. Core mathematical concepts include functions, 3D coordinate systems, and analytical geometry. The construction utilizes GeoGebra's 3D graphing capabilities, Slider animations to control parameters, and the Object Z to represent the function's graph. Suitable for high school students and above studying spatial geometry, function graphs, and parametric plotting, as well as university-level foundational mathematics education.
GeoGebra Commands & Parameters
Z(x, y) = (x^(2) * y)
AI Drawing Prompt Reference
Draw a 3D graph representing the function z=yx^2. Use x and y as variables, with x ranging from -5 to 5 and y ranging from -5 to 5. Observe how the graph changes by adjusting the values of x and y.
The prompt above was compiled from the original drawing commands and is for reference only.