
Graphing Example
Loading the math board and drawing, please wait…
In collections
Parabola Assignment
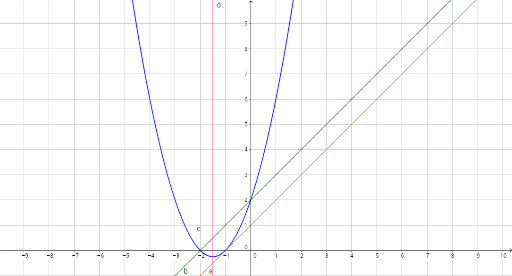
This example demonstrates how to graph geometric shapes using GeoGebra, involving core math concepts like ratios, rhombuses, statistical characteristics, hypothesis testing, and geometric distribution. It uses objects a, b, c, d for construction, suitable for high school and above learners/teachers for teaching demonstrations and exploration.
GeoGebra Commands & Parameters
y = x + 1y = x + 2y = ((x + 1) * (x + 2))x = -3 / 2