
Function Graphing and Numerical Analysis
Loading the math board and drawing, please wait…
In collections
Parabola Assignment
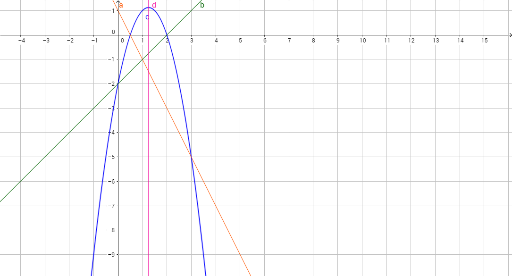
This example demonstrates how to use GeoGebra to plot function graphs and perform numerical analysis. Key math concepts include functions, integrals, limits, and linear equations. It utilizes GeoGebra commands/objects a, b, c, d for function definition, graph plotting, and numerical calculations, suitable for high school and above students learning basic calculus concepts and practical applications.
GeoGebra Commands & Parameters
y = (-2 * x) + 1y = x - 2y = (((-2 * x) + 1) * (x - 2))x = 5 / 4
AI Drawing Prompt Reference
Plot the graphs of the functions y = -2x + 1 and y = x - 2, find their intersection, then plot the graph of their product y = (-2x + 1)(x - 2), and finally draw a vertical line at x = 5/4.
The prompt above was compiled from the original drawing commands and is for reference only.