
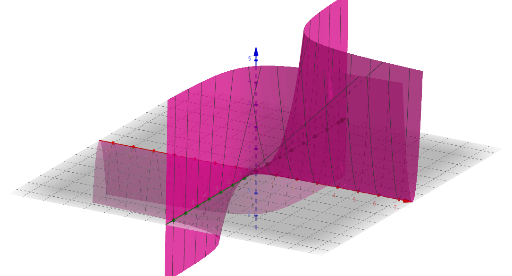
3D Surface of Z=xy^2 Function
Loading the math board and drawing, please wait…
This example demonstrates the 3D surface graph of the function Z=xy^2, showcasing its symmetry and variation trends. Core math concepts include functions, analytical geometry, solid geometry, and limit concepts from calculus. The construction uses the GeoGebra command 'Z' to plot the 3D surface. Suitable for high school and above students to learn and understand the representation of function graphs in 3D space and the application of analytical geometry.
GeoGebra Commands & Parameters
Z(x, y) = (x * y^(2))
AI Drawing Prompt Reference
Draw the 3D surface graph of the function where Z equals x times y squared, showcasing its symmetry and variation trends in 3D space, suitable for high school and above students to learn the representation of function graphs and the application of analytical geometry.
The prompt above was compiled from the original drawing commands and is for reference only.