
GeoGebra Demo: Calculating Summary Statistics (Mean, SD, IQR)
Loading the math board and drawing, please wait…
In collections
AP Stats Exam Review
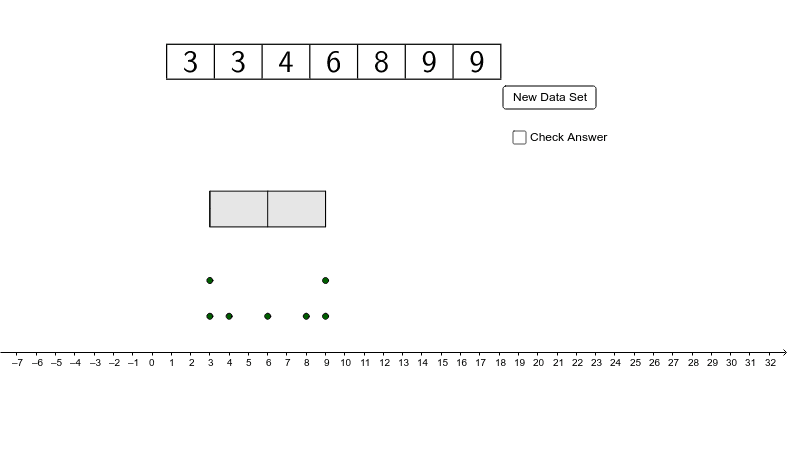
This GeoGebra worksheet demonstrates the dynamic calculation and visualization of key summary statistics, such as the arithmetic mean, sample standard deviation, 5-number summary, and interquartile range (IQR). Core mathematical concepts covered include measures of central tendency, dispersion, and data visualization via dot plots and boxplots. To construct the visualizations, the tool employs GeoGebra commands like Random, Sequence, Sum, and Append to generate data lists, Mean and SampleSD to compute statistical values, and DotPlot and BoxPlot to render graphical representations, with TableText providing dynamic label updates. It is ideal for high school and introductory college-level statistics courses, particularly aligned with quantitative reasoning curricula like AQR, to teach descriptive statistics interactively.
GeoGebra Commands & Parameters
Random(4, 7) → numberSequence(Random[3, 10] + a - a, a, 1, number - 1) → list1Sum(list1) → aAppend(list1, sum - a) → list2SampleSD(list2) → bMean(list2) → cDotPlot(list2) → list3BoxPlot(4, 0.5, list2) → dTableText({Sort[list2]}, "c|_") → text1
AI Drawing Prompt Reference
Draw a scatter plot and a box plot. The scatter plot should show data points from a randomly generated list, including values from sample standard deviation and mean calculations. The box plot should display the distribution of the data. Ensure the graph is clear and labels are correctly displayed.
The prompt above was compiled from the original drawing commands and is for reference only.