
GeoGebra Commands Example
Loading the math board and drawing, please wait…
In collections
How to (3): Commands, Spreadsheets and Statistics
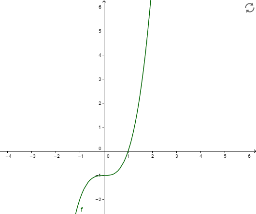
This example demonstrates how to use GeoGebra commands to graph a function. It involves core mathematical concepts such as function representation and graphing. Key construction points include using GeoGebra command objects like f to define and plot functions. Suitable for high school mathematics education, helping students understand the properties of function graphs and graphing techniques.
GeoGebra Commands & Parameters
f(x) = x^(3) - 1