
Generating Extreme Point Arrangements on a Circle
Loading the math board and drawing, please wait…
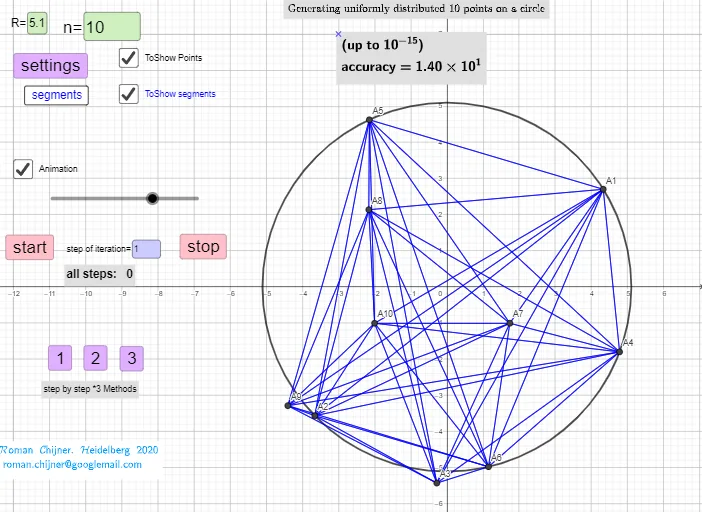
This example demonstrates how to generate extreme point arrangements on a circle, dynamically adjusting point positions to show optimal distributions. Core math concepts include vectors, functions, optimization problems, symmetry, and coordinate geometry. Construction highlights involve using commands like Circle, Textfield, Sequence, and InputBox, with buttons for dynamic control, sliders for animation, and locus visualization. Suitable for high school and above, aiding in understanding geometric constructions and optimization problems.
GeoGebra Commands & Parameters
Circle((0, 0), R) → p1Textfield(n) → InputBox1Sequence(Point[p1, random()], i, 1, n) → l2Textfield(i0) → InputBox2Text(("(up\; to\; 10^{-15})\;\\ accuracy= " * ScientificText[c, 3]), C, true, true) → text8Textfield(R) → InputBox3Sequence(Sequence[Segment[Element[lP, k], Element[lP, t]], t, 1, n], k, 1, n) → l1
AI Drawing Prompt Reference
Generate extreme point arrangements on a circle, dynamically adjusting point positions to show optimal distributions using vectors, functions, optimization problems, symmetry, and coordinate geometry. Start by drawing a circle, then create an input box for the number of points and randomly place that many points on the circle. Another input box is used for the circle's radius, and accuracy information for the optimization problem is displayed. Finally, draw line segments between all points to form a mesh structure showing their connections.
The prompt above was compiled from the original drawing commands and is for reference only.