
Finding Geometric Medians and Centers on a Circle from Sample Points
Loading the math board and drawing, please wait…
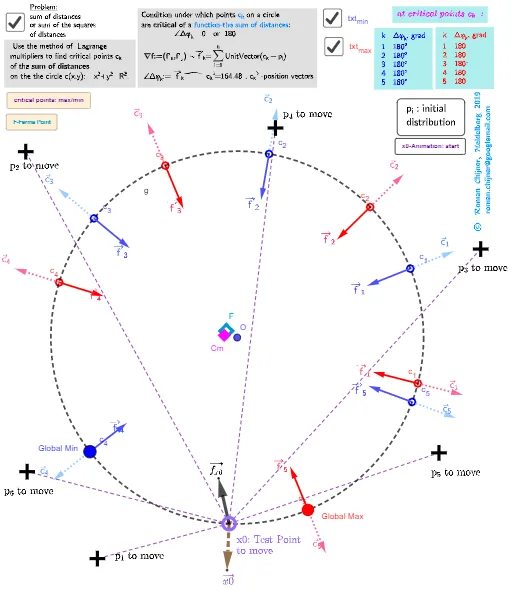
This example demonstrates how to find geometric medians and centers on a circle using discrete sample points. Key math concepts include vectors, geometric transformations, optimization problems, and coordinate geometry. GeoGebra commands and objects used in construction are Sum, Circle, Point, Zip, Segment, Textfield, Sequence, Vector, Angle, Length, TableText, Text, Element, RotateText, Sort, If, and UnitVector. Suitable for high school and above students to understand geometric processing and optimization of discrete data points.
GeoGebra Commands & Parameters
Sum(Zip[sqrt(((R * cos(x)) - x(b))^(2) + ((R * sin(x)) - y(b))^(2)), b, lP]) → f0Circle(O, R) → gPoint(g) → x0Zip(Vector[UnitVector[a - x0]], a, lP) → l1Sum(Zip[Length[a - x0], a, lP]) → sumSum(Zip[Length[a - x0]^(2), a, lP]) → sum_qSum(Zip[Length[a - min_q0]^(2), a, lP]) → sum1_qSum(Zip[Length[a - max_q0]^(2), a, lP]) → sum2_qSegment(max_q0, min_q0) → hTextfield(na) → InputBox1Sequence((R; ((2 * π / na) * j)), j, 0, na) → ltest_2Zip((R; a), a, x(Extr_g)) → lZZsad'Vector(x0, x0 + UnitVector[Sum[l1]]) → l11Vector(x0, x0 + UnitVector[x0]) → l12Angle(l11, l12) → αZip(Vector[b, b + UnitVector[Sum[Zip[UnitVector[a - b], a, lP]]]], b, lZmax') → Wi_PmaxZip(Vector[b, b + UnitVector[Sum[Zip[UnitVector[a - b], a, lP]]]], b, lZmin') → Wi_PminZip(Vector[x0, x0 + UnitVector[x0]], x0, lZmax') → Wi_Pmax'Zip(Vector[x0, x0 + UnitVector[x0]], x0, lZmin') → Wi_Pmin'Zip(Angle[a, Vector[b]], Vector[a], Wi_Pmax, Vector[b], Wi_Pmax') → Wii_pmaxZip(Angle[a, Vector[b]], Vector[a], Wi_Pmin, Vector[b], Wi_Pmin') → Wii_pminZip(Segment[x0, a], a, lP) → l0Zip((a, f1(a)), a, x(lExtr')) → lExtrf'Length(lExtrf') → läSum(Zip[((R * cos(x)) - x(b))^(2) + ((R * sin(x)) - y(b))^(2), b, lP]) → f0_qZip((a, f1(a)), a, Zip[Angle[a], a, lZmin']) → lmin1Zip((a, f1(a)), a, Zip[Angle[a], a, lZmax']) → lmax1Zip((a, f1(a)), a, Zip[Angle[a], a, lZZsad']) → lsadVector(C, C + (0, 0.5)) → uVector(C_q, C_q + (0, 0.5)) → u_qTextfield(s) → InputBox2Textfield(s_q) → InputBox3TableText(Append["k", 1…Length[Wii_pmin]], Append["Δφ_k, grad", Wii_pmin], "v") → text23minTableText(Append["k", 1…Length[Wii_pmax]], Append["Δφ_k, grad", Wii_pmax], "v") → text23maxText("f(x)", (-0.1, f1(0) + 0.2)) → text6Text("f_q(x)", (-0.1, f1_q(0) + 0.2)) → text6bElement(lmax1, IndexOf[Max[y(lmax1)], y(lmax1)]) → D1Element(lmin1, IndexOf[Min[y(lmin1)], y(lmin1)]) → D2Zip(Point[a, 1], Vector[a], Wi_Pmax) → PmaxZip(Point[a, 1], Vector[a], Wi_Pmin) → PminZip(Point[a, 1], Vector[a], Wi_Pmax') → Pmax'Zip(Point[a, 1], Vector[a], Wi_Pmin') → Pmin'Point(l11, 1) → Tpoint1Point(l12, 1) → Tpoint2Zip(Text["c_" + (a) + "", b], a, 1…Length[lZmin'], b, lZmin' + (0.2, 0.2)) → txtminElement(lZmin', IndexOf[Min[y(lmin1)], y(lmin1)]) → AGlobalminElement(lZmax', IndexOf[Max[y(lmax1)], y(lmax1)]) → AGlobalmaxRotateText(txt, 90°) → txt1Sort(Flatten[x(lExtr')]) → xlExtr'Zip((abs(a - b) / a * 100), a, xlExtr', b, xlMaxmin) → ΔZip(ScientificText[a, 3], a, Δ) → Δ1TableText(Append["k", 1…lä], Append["δ=\frac{x_{Extr}-x_{iter}}{x_{Extr}}*100% ", Δ1], "v") → text23ΔIf(x0 ≟ min_q0 ∨ x0 ≟ max_q0, true, false) → bue1Zip(Text["c_" + (a) + "", b], a, 1…Length[lZmax'], b, lZmax' + (-0.2, 0.2)) → txtmaxZip(Text["\vec{c}_ " + (a) + "", b, true, true], a, 1…Length[lZmax'], b, Pmax' + (-0.35, 0.35)) → txtPmax'Zip(Text["\vec{c}_ " + (a) + "", b, true, true], a, 1…Length[lZmax'], b, Pmin' + (-0.35, 0.35)) → txtPmin'Zip(Text["\overrightarrow{f}_" + (a) + "", b, true, true], a, 1…Length[lZmax'], b, Pmax + (-0.4, 0.2)) → txtPmaxZip(Text["\overrightarrow{f}_" + (a) + "", b, true, true], a, 1…Length[lZmax'], b, Pmin + (-0.4, 0.1)) → txtPminUnitVector(Vector[x0, x0 - A]) → wAngle(w, l12) → βZip(Vector[x0, x0 + UnitVector[Vector[x0, x0 - (Length[lP] * x0) - Sum[lP]]]], x0, lZ_q) → wq_iZip(Vector[x0, x0 + UnitVector[x0]], x0, lZ_q) → wcq_iIf(b, "sum of distances", "sum of the squares of distances") → txtsumPoint(w, 1) → Tpoint2_q
AI Drawing Prompt Reference
Draw a circle with a set of discrete sample points on it. Place a movable point on the circle and compute the sum of distances and squared distances from this point to all samples, displaying the values. Find the points on the circle that minimize and maximize the squared distance sum, and connect them with a segment. From each candidate point, draw an arrow in the direction of the sum of unit vectors toward the samples, and measure the angle between this arrow and the radial direction. Plot function curves outside the circle with angle as horizontal axis and distance sum or squared sum as vertical axis, marking extrema. Add a table listing angle differences for candidates and text labels.
The prompt above was compiled from the original drawing commands and is for reference only.