
Gal 4: Density Function and Pyramid Probability Distribution
Loading the math board and drawing, please wait…
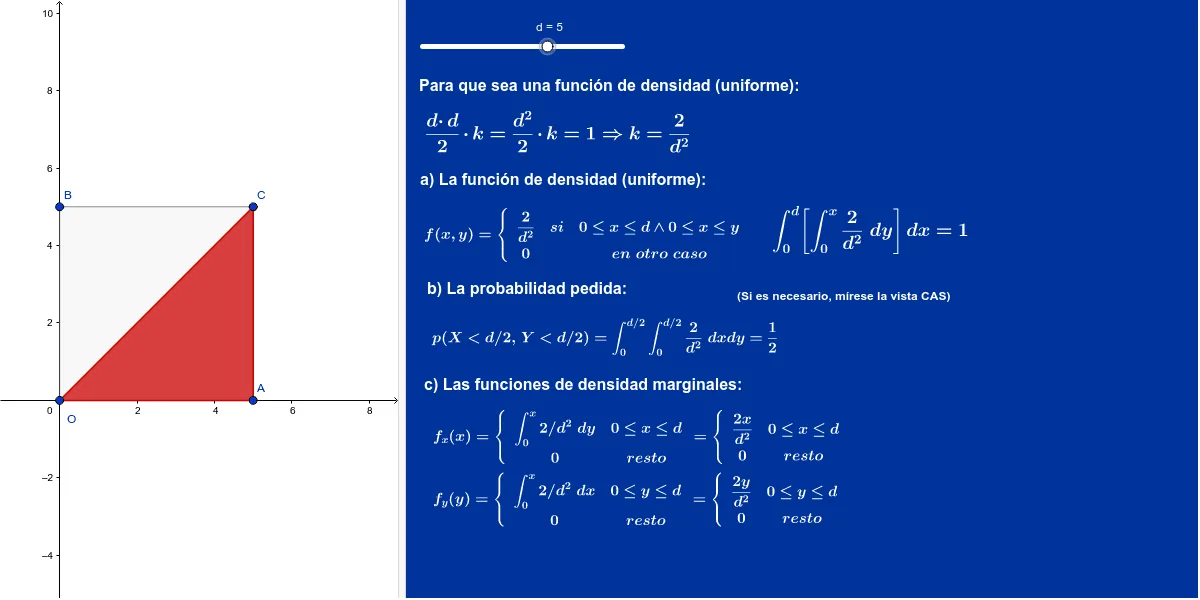
① This example demonstrates how to combine a geometric pyramid with a density function to visually illustrate the meaning of a probability density function and compute probabilities via integration. ② Core mathematical concepts include probability density functions, definite integrals, median value, the relationship between pyramid volume and probability, and step functions for discrete distributions. ③ Construction highlights: from the construction summary, the GeoGebra commands used are Intersect and Polygon, involving objects such as points A, B, C, O, and multiple text objects (text1 to text9) for labeling, along with matrices, incircle, and other elements possibly used to build cross-sections or auxiliary lines of the pyramid. ④ Suitable for high school to early college students learning probability and statistics, helping them understand density functions, integration for probability, and geometric intuition in probability.
GeoGebra Commands & Parameters
Intersect(xAxis, yAxis) → OPolygon(O, B, C, A) → q1, o, b, c, aPolygon(O, C, A) → t1, a_1, o_1, c_1
AI Drawing Prompt Reference
Draw a three-dimensional pyramid with a quadrilateral base, apex at the origin, and base vertices positioned on coordinate axes and in the plane, forming a solid cone. Overlay a probability density function curve that rises and falls near the origin, intersecting the pyramid's side faces, with shaded regions indicating probability. Use polygons to outline the base and side faces, and add text labels explaining the density function, integration, and probability. Keep the composition clear, emphasizing the geometric interpretation of probability.
The prompt above was compiled from the original drawing commands and is for reference only.