
Functions & Graphs Review
Loading the math board and drawing, please wait…
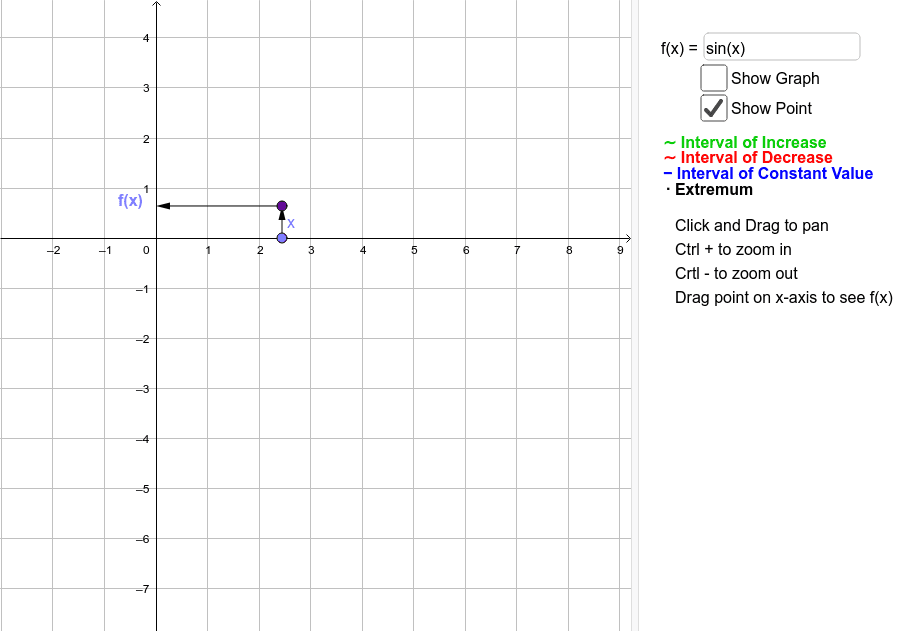
This example demonstrates the plotting of function graphs and their key characteristics. Core math concepts include function definition, graph features, derivatives, and integrals. Construction highlights involve commands like Corner, Textfield, Point, Vector, and objects such as f, fd, fc, fi, LC, RC, lvis, rvis, InpF, text1, text2, text3, text4, text5, xslider, FP, LE, vectorxP, vectorPy. Suitable for high school and above mathematics learners for function graph analysis education.
GeoGebra Commands & Parameters
Corner(1, 1) → LCCorner(1, 3) → RCTextfield(f) → InpFPoint(xAxis) → xsliderVector((x(xslider), 0), (x(xslider), f(x(xslider)))) → vectorxPVector((x(xslider), f(x(xslider))), (0, f(x(xslider)))) → vectorPy