
Function Translation Example
Loading the math board and drawing, please wait…
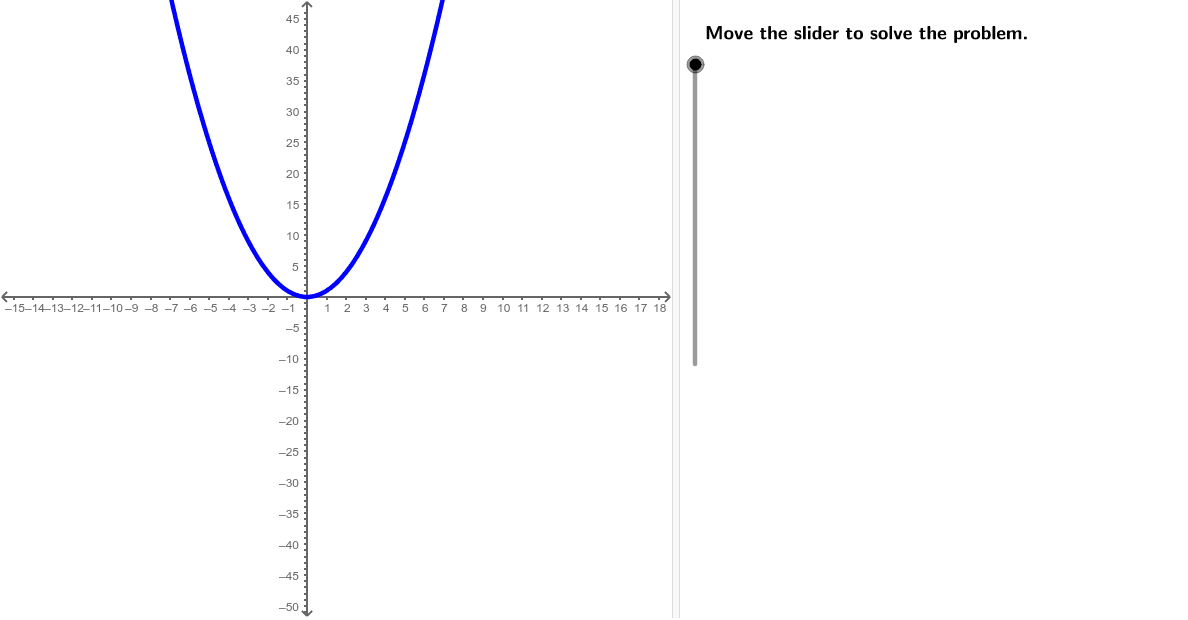
This example demonstrates the transformation of the graph of f(x)=x^2 when shifted horizontally by k units, exploring the concept of function graph translation and the effect of variable transformation f(x+k). It utilizes GeoGebra commands like Point, Line, Sequence, If, Textfield, and TableText for construction. Suitable for high school students learning function graph transformations.
GeoGebra Commands & Parameters
Point(xAxis) → FPoint(xAxis) → APoint(xAxis) → BPoint(xAxis) → CPoint(xAxis) → DPoint(xAxis) → ELine((x(Corner[1]) + ((2 * indent) * screenwidth), 0), yAxis) → align1Line((x(Corner[1]) + ((3 * indent) * screenwidth), 0), yAxis) → align2Line((x(Corner[1]) + ((4 * indent) * screenwidth), 0), yAxis) → align3Sequence(p(Element[xValues, i]), i, 1, Length[xValues]) → pValuesSequence(f(Element[xValues, i]), i, 1, Length[xValues]) → fValuesSequence((Element[xValues, i], Element[fValues, i]), i, 1, Length[xValues]) → fPointsSequence((Element[xValues, i], Element[pValues, i]), i, 1, Length[xValues]) → pPointsIf(k ≥ 0, "+", "") → showsignIf(k ≥ 0, "left", "right") → directionTextfield(f) → inputBox1TableText({{A1, B1, C1, D1, E1, F1}, {A2, B2, C2, D2, E2, F2}, {A3, B3, C3, D3, E3, F3}}, "|_") → tabletext
AI Drawing Prompt Reference
Create a visual example demonstrating the transformation of the graph of f(x)=x^2 when shifted horizontally by k units. Start by plotting several points on the x-axis, then draw three parallel lines through these points. Generate sequences for the values of f(x) and p(x+k), and connect these points to form the graphs. Include labels for the functions and the direction of translation beside the graph.
The prompt above was compiled from the original drawing commands and is for reference only.